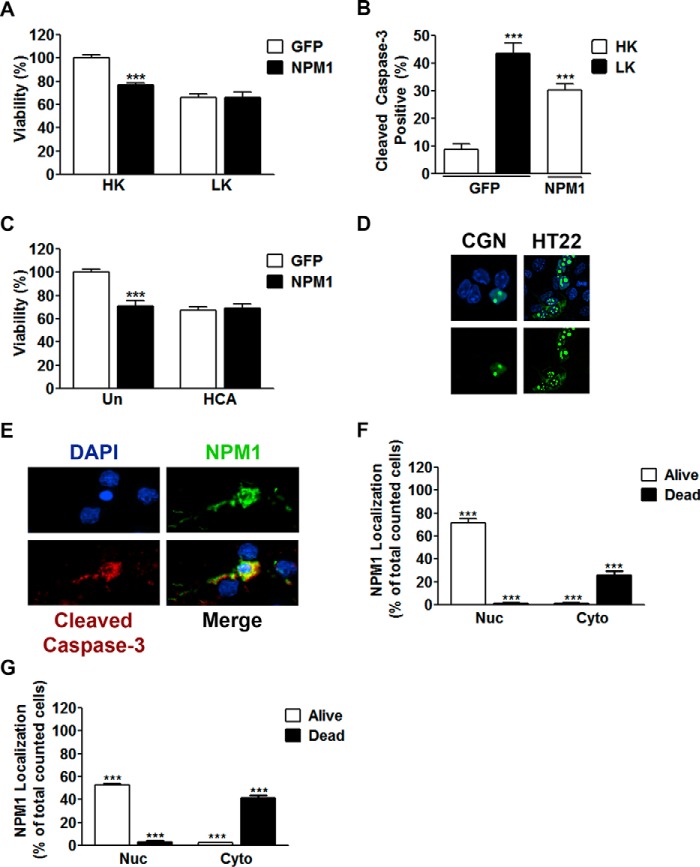
FIGURE 2.
Increased expression of NPM1 is toxic to otherwise healthy neurons. A, CGNs transfected with either EGFP or NPM1 and treated with HK or LK media as described under “Experimental Procedures.” Viability of transfected cells was quantified by immunocytochemistry with GFP or FLAG antibodies. ***, p < 0.001 as compared with EGFP HK (n = 4). B, CGNs transfected as performed in A. Viability was quantified by immunocytochemistry with GFP or FLAG antibodies co-stained for cleaved caspase-3. ***, p < 0.001 as compared with EGFP HK (n = 3). C, cortical neurons transfected with either EGFP or NPM1 for 8 h and then either left untreated (Un) or treated with HCA for 15–16 h. Viability was quantified as done in A. ***, p < 0.001 as compared with untreated EGFP (n = 3). D, representative image showing localization of ectopic NPM1 expression in living cells. NPM1 was transfected into CGNs (left panels) or HT22 cells (right panels) for 24 h. CGNs were then treated with HK medium for an additional 24 h. The cells were then fixed and DAPI-stained, and NPM1 was imaged by EGFP autofluorescence. E, representative image showing localization of ectopic NPM1 in apoptotic neurons from B. NPM1 displayed a nucleolar and nucleoplasmic localization in healthy living cells and a cytoplasmic localization in dead cells. F and G, quantitation of NPM1 localization in relation to cell viability from CGNs (F) transfected in B and cortical neurons (G) transfected in C. Each graph represents ≥800 cells counted. ***, p < 0.001 (n = 3).

