FIGURE 6.

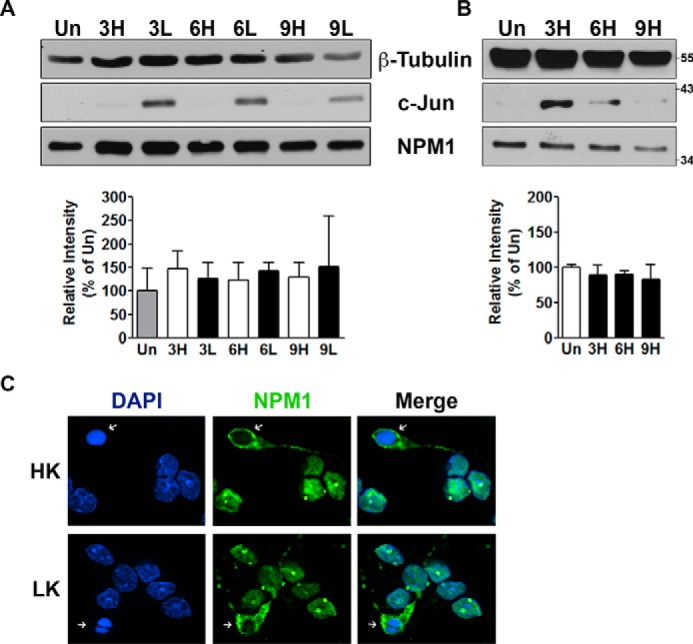
Expression pattern of endogenous NPM1. A and B, protein expression (top panels) and densitometric analysis (bottom panels) presented as means ± S.D. of endogenous NPM1 in CGN (A, n = 5) and cortical (B, n = 3) cultures. The cells were either left untreated (Un) or treated with HK/LK medium (CGNs) or HCA (corticals) for 3, 6, and 9 h. Endogenous NPM1 expression was analyzed as described under “Experimental Procedures.” β-Tubulin serves as a loading control and c-Jun serves as a marker for induction of apoptosis. C, representative image showing localization of endogenous NPM1 in 6-h HK/LK-treated CGNs. Arrows indicate NPM1 localized to the cytoplasm of apoptotic cells.
