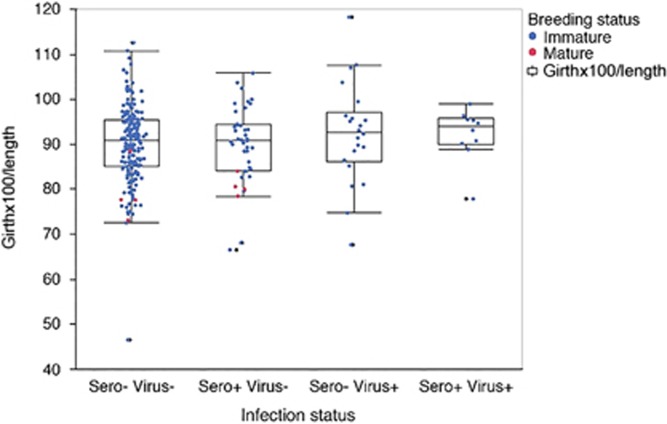
Figure 2.
Animals are grouped by infection status based on seroprevalence (sero) and detection of viral RNA (virus). Graphed from left to right are sero/virus −/−, +/−, −/+, +/+. Each animal is shown as a single data point representing the Smirnov body condition index of girth × 100/length; immature animals (blue), mature animals (red). Whisker and box plot represent 5th and 95th quartiles.

