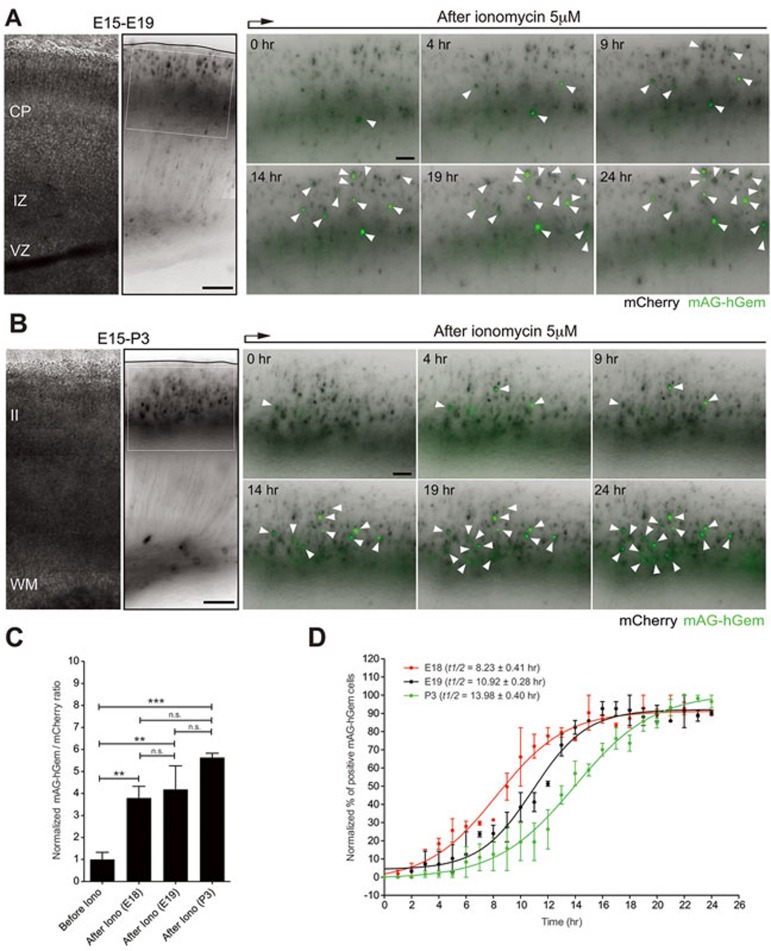
Figure 4.
Calcium influx induces faster nuclear mAG-hGem expression in neurons from the CP compared to neurons from layer II. (A) mCherry/mAG-hGem-transfected cells located in the CP at E19 express the S/G2/M marker mAG-hGem (white arrowheads) upon ionomycin treatment (5 μM). Left panels: cortical slice used for time-lapse at E19 (in utero electroporated at E15). Right panels: Time-lapse sequence of CP-neurons upon ionomycin treatment (inset from left panel). (B) mCherry/mAG-hGem-transfected cells located in layer II at P3 express the S/G2/M marker mAG-hGem (white arrowheads) upon ionomycin treatment (5 μM). Left panels: cortical slice used for time-lapse at P3 (in utero electroporated at E15). Right panels: Time-lapse sequence of layer II-neurons upon ionomycin treatment (inset from left panel). (C) 24 h ionomycin treatment induced similarly nuclear mAG-hGem expression in mCherry-electroporated neurons from the CP at E18-E19 and layer II at P3 (****P < 0.0001 by one-way ANOVA, post hoc Dunnett test; ***P < 0.001, **P < 0.01; values are mean ± SEM). (D) Nuclear mAG-hGem expression in neurons from the CP at E18-E19 is faster compared to layer II neurons at P3 (one-way ANOVA, post hoc Tukey test; E18 vs E19, not significant; E18 vs P3, ***P < 0.001; E19 vs P3, **P < 0.01; values are mean ± SEM). Scale bar: 150 μm (left panels) and 100 μm (right panel).

