
Figure 4.
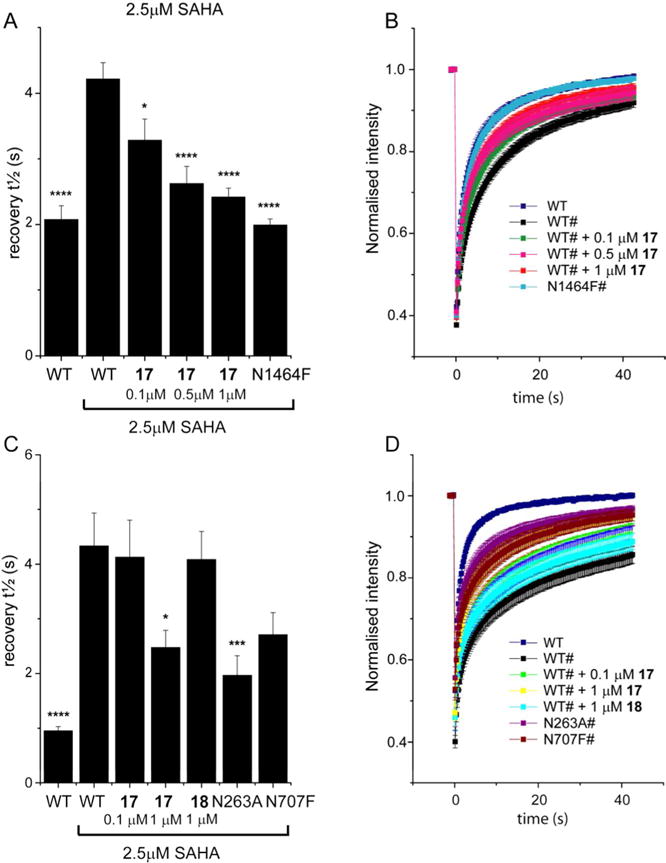
SMARCA2 and PB1 FRAP Assays. (A): Half-life of fluorescence recovery (t½) for transfected cells expressing GFP-tagged SMARCA2 (WT) treated with compound 17 at different doses or mutant SMARCA2 (N1464F). Shown are bars representing the mean t½ calculated from individual recovery curves of at least 20 cells per group and error bars depict the standard error of the mean (SEM). (B): Raw data fluorescent recovery curves corresponding to the fluorescence recovery shown in panel (A). (C): Half recovery times of fluorescence recovery (t½) for transfected cells expressing GFP-tagged PB1 (WT) treated with compound 17 at different doses or mutant PB1 (N263A or N707F). Shown are bars representing the mean t½ calculated from individual recovery curves of at least 20 cells per group and error bars depict the standard error of the mean (SEM). (D): Raw data fluorescent recovery curves corresponding to the fluorescence recovery shown in panel (C). * indicates a p-value compared to WT treated with 2.5 μM SAHA **** p<0.0001; *** p<0.001; * p<0.03.