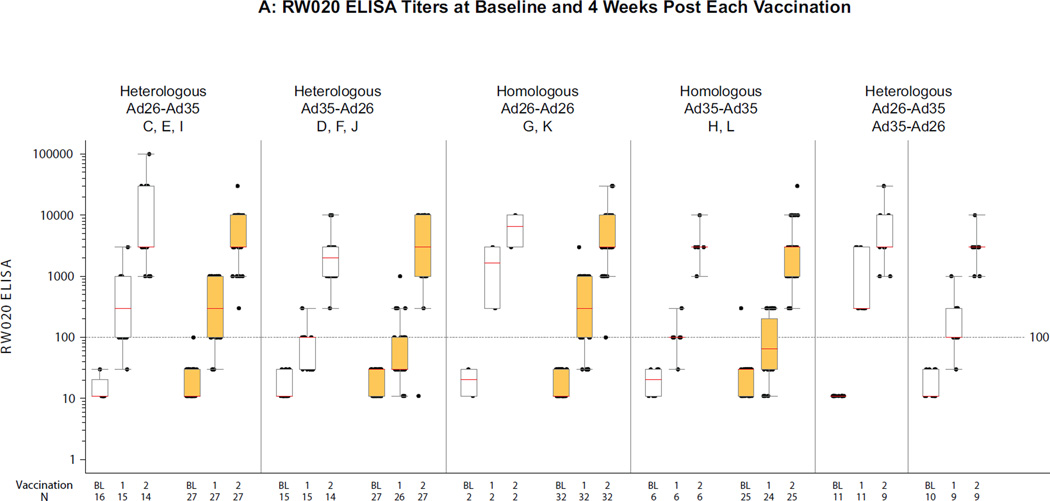
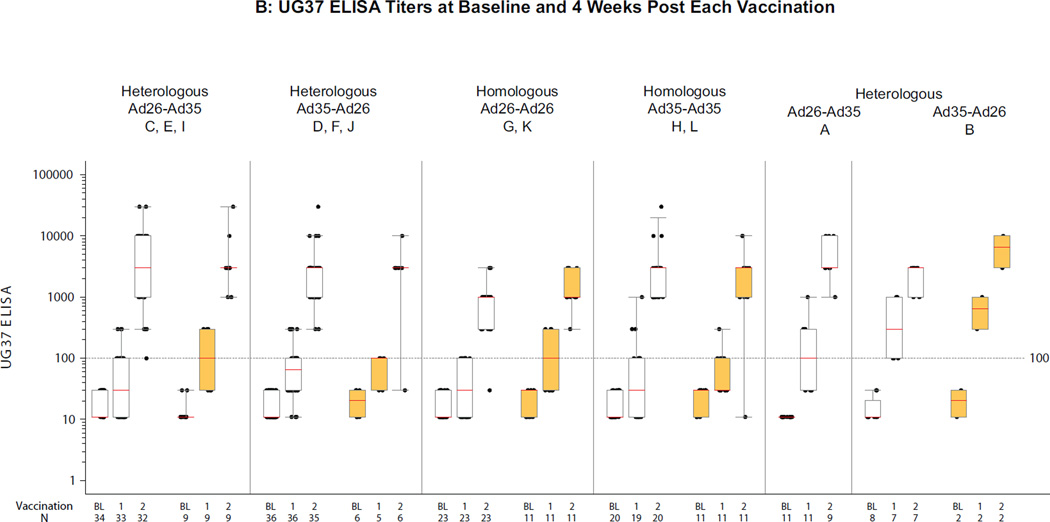
Figure 2. Distribution of ELISA titers 4 weeks after each vaccination per regimen.
A) RW020 ELISA Titers (RW020 Env is homologous to the Ad26 Env insert); B) UG37 ELISA Titers (UG37 Env is 81.2% homologous to the Ad35 Env insert). Second vaccinations were at month 6 in Groups A and B, and month 3 otherwise. Boxes represent the 1st and 3rd quartiles (IQR). Red lines indicate median titer. Whiskers extend to the 5th and 95th percentiles. White/orange boxes represent negative/positive baseline Ad26 NAb (A) and Ad35 NAb (B) values. On the X-axis, B, 1 & 2 represent baseline and 4 weeks post first and second vaccinations respectively.


