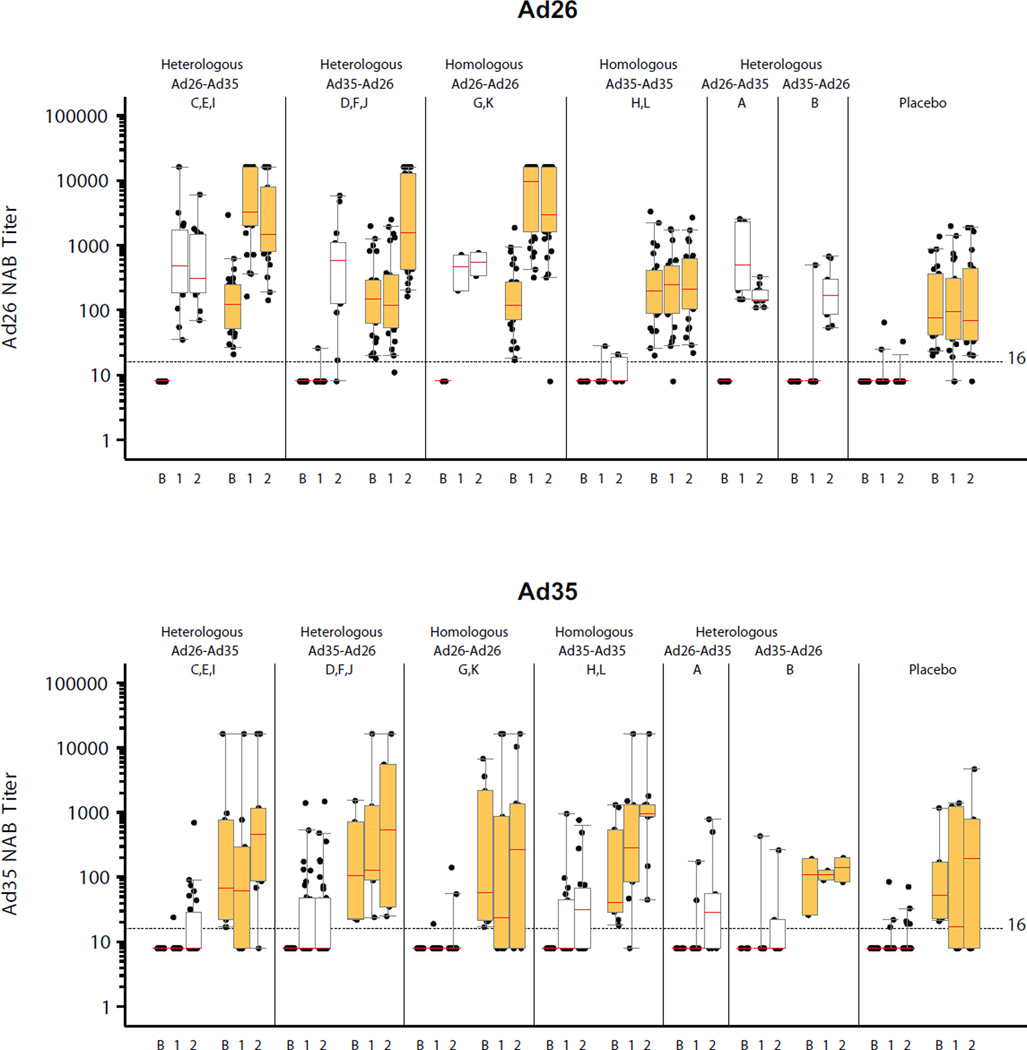
Figure 5. Ad26 and Ad35 neutralizing titers.
Individual Ad26 and Ad35 neutralizing antibody responses from volunteers at baseline and 4 weeks post first and second vaccination are shown. Second vaccinations were at month 6 in Groups A and B, and month 3 otherwise. White/orange boxes represent negative/positive baseline Ad26 (top panel) and Ad35 (bottom panel) neutralizing antibodies. Boxes represent median, IQR and the 5th + 95th percentiles of the titer distribution. On the x-axis, B, 1 & 2 represent baseline and 4 weeks post first and second vaccinations respectively. Placebo responses represent the proportion of volunteers with a positive titer at any time.

