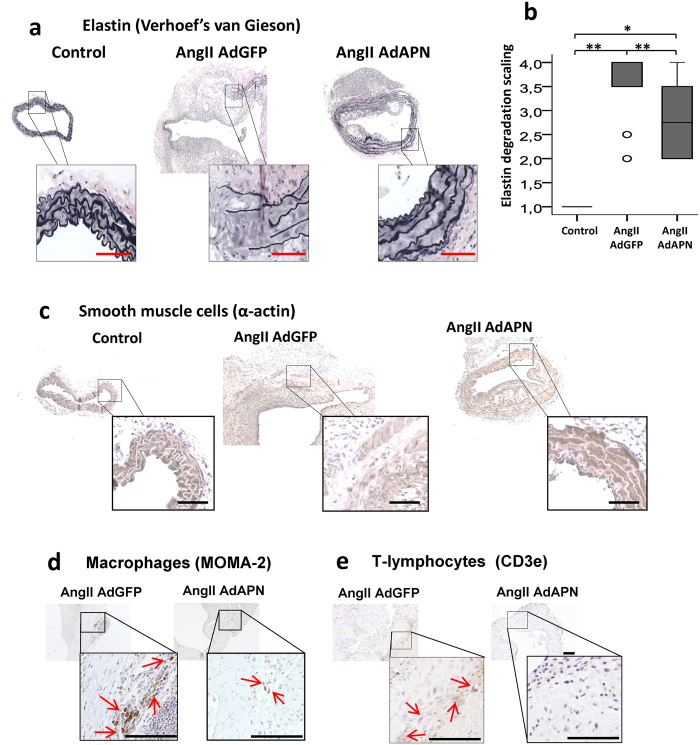
Figure 3. Adiponectin expression inhibited AngII-induced elastin degradation, infiltration of inflammatory cells and preserved vascular smooth muscle cells in the abdominal aorta of hyperlipidemic LDLR−/− mice.
(a) Elastin staining using Verhoeff’s van Geison stain in representative abdominal aorta cross-sections from control (PBS) and AngII-infused and AdGFP or AdAPN injected mice after 8 weeks. (b) Quantification of elastin degradation in abdominal aorta of control (PBS-infused, n = 8) and AngII-infused and AdGFP (n = 12) or AdAPN (n = 8) injected mice after 8 weeks. Results are presented in box plot using median (line) with the 25th and 75th percentiles. T-bars indicate outliers 1.5 times the box height and the circles 1.5 times the interquartile range. **p < 0.01 vs AdGFP and Control, *p < 0.05 vs AdAPN, ANOVA. (c) Representative immunostained images of vascular smooth muscle cells (SMC22α) localization in the abdominal aortic cross-sections from control (PBS-infused) and AngII-infused and AdGFP or AdAPN injected mice after 8 weeks. Immunolocatization of macrophages (MOMA2) (d) and T-lymphocytes (CD3e) (e) in abdominal aorta from AngII-infused and AdGFP or AdAPN injected mice after 8 weeks. Infiltration of inflammatory cells is detected only in AngII-infused mice and not in PBS-infused mice. Red arrows represent macrophage-rich (d) and T-lymphocyte-positive (e) areas. Areas of abdominal aortic cross-sections (a,c,d,e) represented in boxes are shown at higher magnification. Scale bar = 50 μm.

