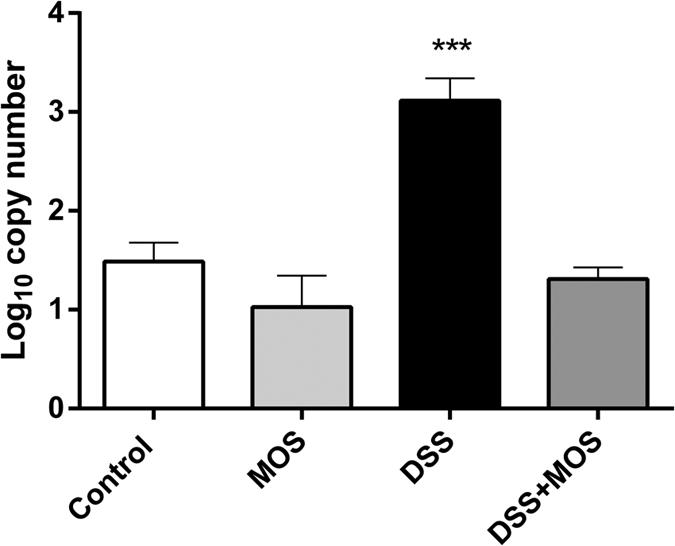
Figure 3. Changes in Coliform bacteria in the colon.

Data are expressed as log10 copy number/ng genomic DNA isolated from colon content of control, MOS-treated, DSS-treated and DSS + MOS-treated animals. ***p < 0.001 compared to control.

Data are expressed as log10 copy number/ng genomic DNA isolated from colon content of control, MOS-treated, DSS-treated and DSS + MOS-treated animals. ***p < 0.001 compared to control.