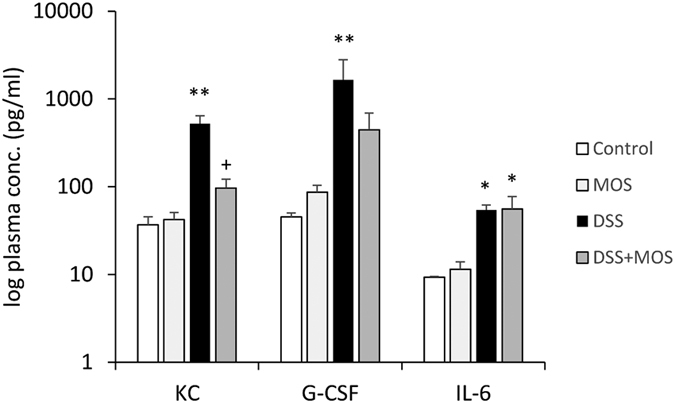
Figure 7. DSS treatment elevates plasma levels of KC, G-CSF and IL-6.

Mean ± SEM values of KC, G-CSF and IL-6 in plasma samples of mice that were control or exposed to DSS and treated with vehicle or MOS. *p < 0.05, **p < 0.01 compared to control mice; +p < 0.05 compared to DSS treated animals.
