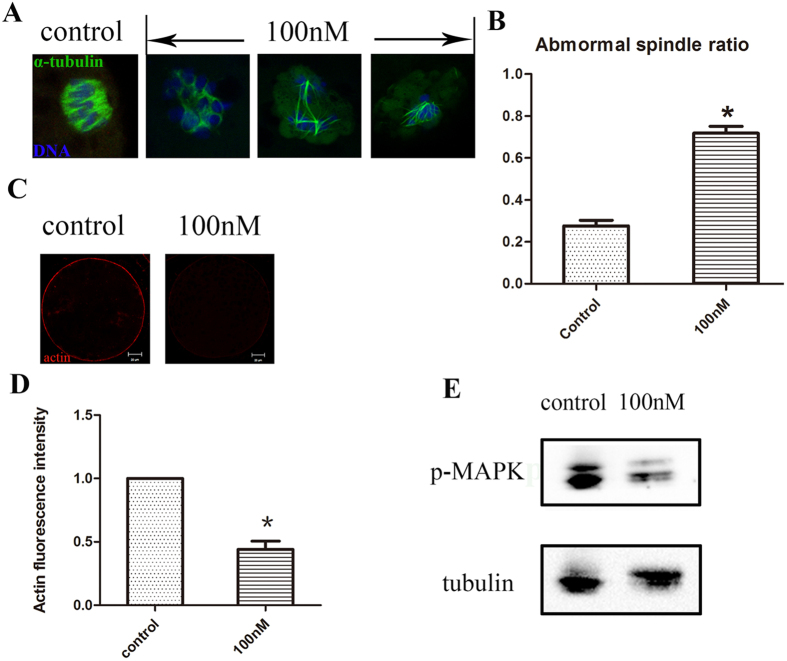
Figure 2. HT-2 toxin effects on spindle morphology and actin expression.
(A) Spindle morphologies were disrupted after exposure to HT-2 toxin. In the control group, the oocyte showed normal spindle morphology, while in the treatment group the spindle formation failed, showing with no poles spindle or bad shape spindle. α-tubulin, green; DNA, blue. (B) Abnormal spindle rate was increased after exposure to HT-2 toxin than the control group. (C) Actin expression in the control and HT-2 toxin treatment groups. Actin expression was reduced after exposure to HT-2 toxin. Actin, red; DNA, blue. (D) Statistical comparisons of membrane actin fluorescence intensity for control and HT-2 toxin treatment groups. Actin fluorescence intensities in the membrane were reduced in treatment group. (E) Cropped blots are used in this figure, and the gels have been run under the same experimental conditions. Full-length blots are included for key data in the supplementary information. Western blot results showed that p-MAPK level was significantly reduced after exposure to HT-2 toxin. *p < 0.05. Bar = 20 μm.

