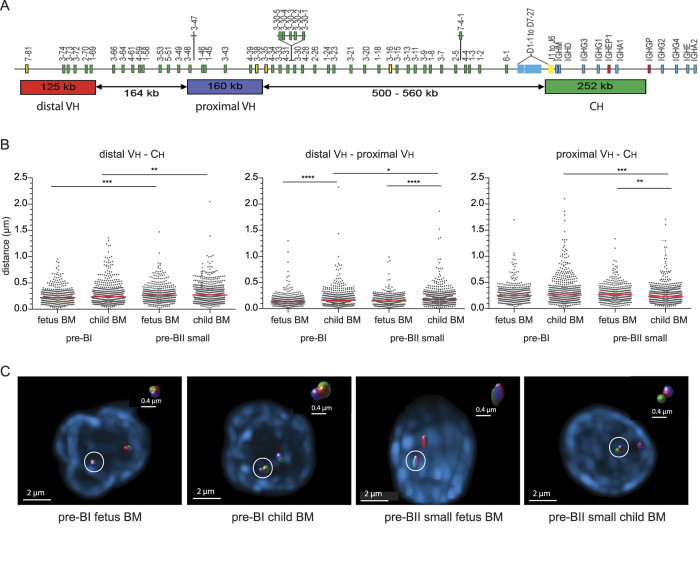
Figure 5. IGH locus contraction in fetal and pediatric B-cell precursors.
(A) The human IGH locus with details of BAC clones used as 3D FISH probes44,46. (B) Spatial distances separating distal Vh, proximal Vh, and Ch regions in precursor-B cells from fetal and pediatric BM. Grey dots represent individual alleles, red bars median values. Per group, >200 alleles from 2 donors were analyzed. Statistics: Mann–Whitney U test; *p < 0.05, **p < 0.01, ***p < 0.001, ****p < 0.0001. (C) Representative images of stained IGH loci.

