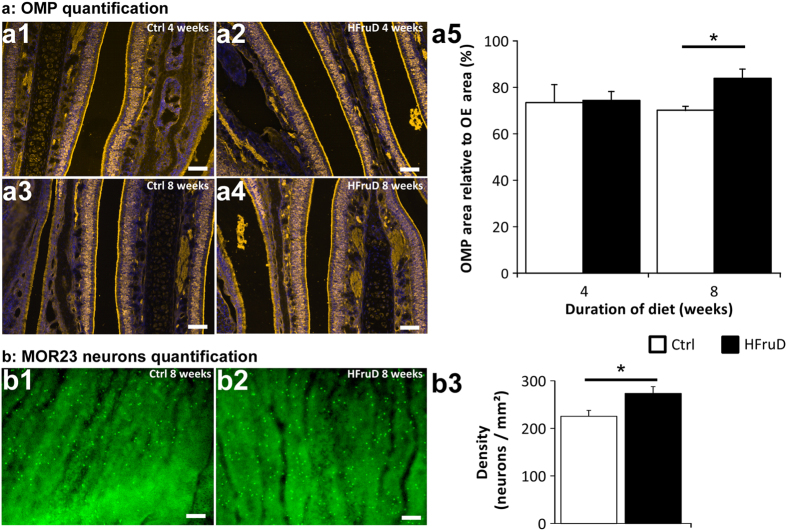
Figure 3. Olfactory sensory neurons’ number is increased after 8 weeks of HFruD.
(a) The number of OSNs in the olfactory mucosa was determined using an antibody against OMP labelling. (a1–4) Representative OMP labelling images. Yellow: OMP, blue: Hoechst. Scale bars: 50 μm. (a5) Quantification of relative OMP labelling area after 4/8 weeks of diet (control n = 5/6 animals, HFruD n = 5/6 animals). *p < 0.05 after Mann-Whitney’s test. (b) Whole-mount preparation of olfactory epithelium showing MOR23 neurons’ density increase after 8 weeks of HFruD. (b1–2) Representative images of MOR23 neurons expression in the olfactory epithelium. Scale bar: 50 μm. (b3) Quantification of MOR23 neurons’ density in the olfactory epithelium. Bar graphs represent mean values (±SEM) for control (n = 12) and HFruD (n = 9) animals. *p < 0.05 after Mann-Whitney’s test.

