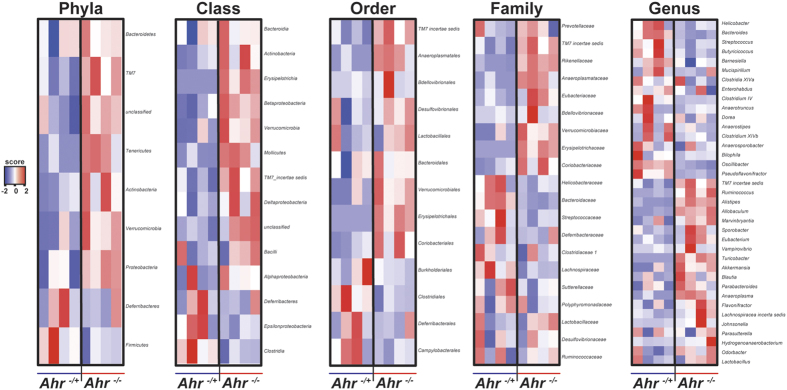
Figure 2. Analysis of microbial taxonomic population changes in ceca of Ahr−/+ and Ahr−/− mice following genotypic segregation.
Heat map representation of individual percentage 16S read abundance at taxonomic (phyla, class, order, family and genus) levels of cecal microbiota from genotypically segregated Ahr−/+ and Ahr−/− littermates. Data are represented as Log2 transformed 16S read percentage abundance for each individual (n = 4/genotype) with high to low abundance indicated by red to blue, respectively.

