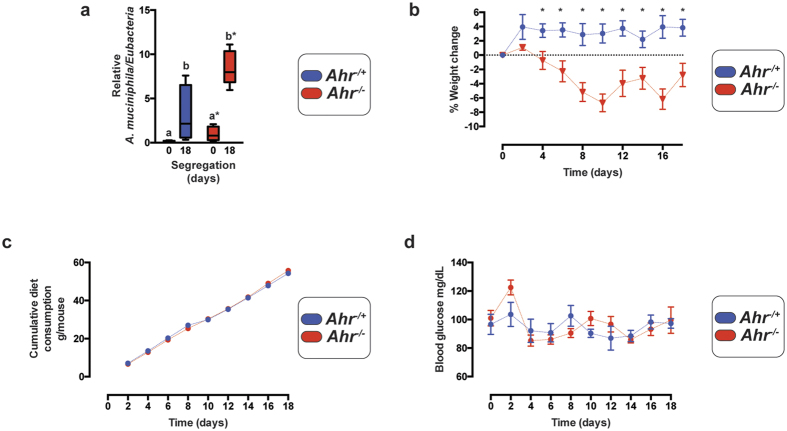
Figure 3. Segregation of Akkermansia muciniphila abundance between Ahr genotypes.
(a) Quantitative real time PCR analysis of fecal Akkermansia muciniphila abundance prior to and following genotypic segregation. Data represent min-max and median fecal Akkermansia muciniphila 16S rDNA gene abundance normalized to Eubacteria from Ahr−/+ (blue) and Ahr−/− (red) (n=4/genotype). Analyses were performed using Student’s t-test *p < 0.05. (b) Quantification of percentage weight change during the course of genotypic segregation. Mice were weighed every 48 h at 10–11 am and percentage weight change relative to initial weight calculated. Data represent mean percentage weight change +/− SD in Ahr−/+ (blue circle) and Ahr−/− (red triangle) (n = 4/genotype). Analyses were performed using Student’s t-test *p < 0.05. (c) Quantification of food intake during genotypic segregation. Data represent cumulative food intake expressed as g/mouse (n = 4/genotype) from Ahr−/+ (blue circle) and Ahr−/− (red circle). (d) Analysis of blood glucose during genotypic segregation. Blood glucose levels were determined every 48 h at 10–11 am through tail clip bleed and a hand-held glucose monitor. Data represent mean glucose concentration (mg/dL) +/− SD from Ahr−/+ (blue circle) and Ahr−/− (red circle).

