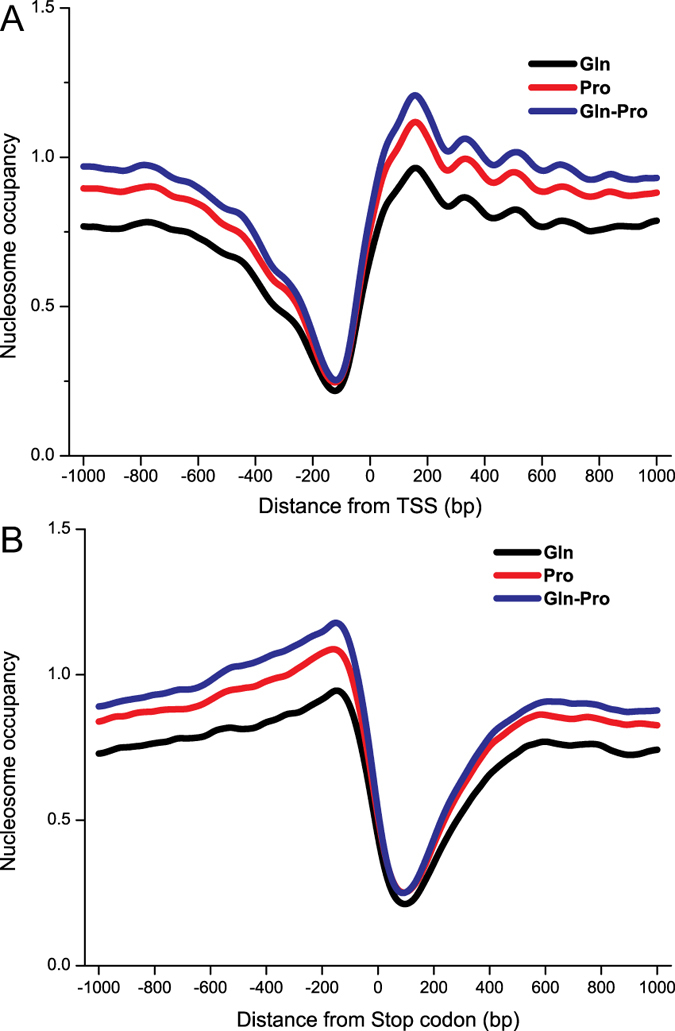
Figure 1. Patterns of nucleosome occupancy of S. cerevisiae under different nitrogen conditions.

(A) Nucleosome occupancy profiles of all genes in the yeast genome from −1000 bp to +1000 bp with respect to the TSS. (B) Nucleosome occupancy profiles of all genes in the yeast genome from −1000 bp to +1000 bp with respect to the stop codon.
