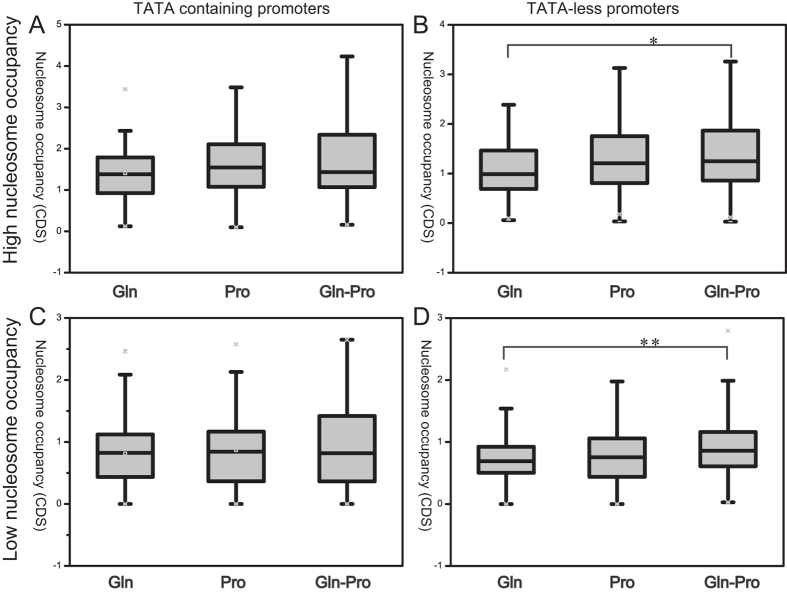
Figure 5. Correlation between nucleosome occupancy at NFRs and gene coding regions for TATA-containing and TATA-less promoters.
(A) TATA-containing; (B) TATA-less promoters with high nucleosome occupancy; (C) TATA-containing; (D) TATA-less promoters with low nucleosome occupancy. Gln, Pro and Gln-Pro represent the culture conditions in M.Gln, M.Pro and in response to the shift from M.Gln to M.Pro for 2 h, respectively. P-values were calculated using the Wilcoxon rank sum test, P < 0.05 (*), < 0.01 (**) and <0.001 (***).

