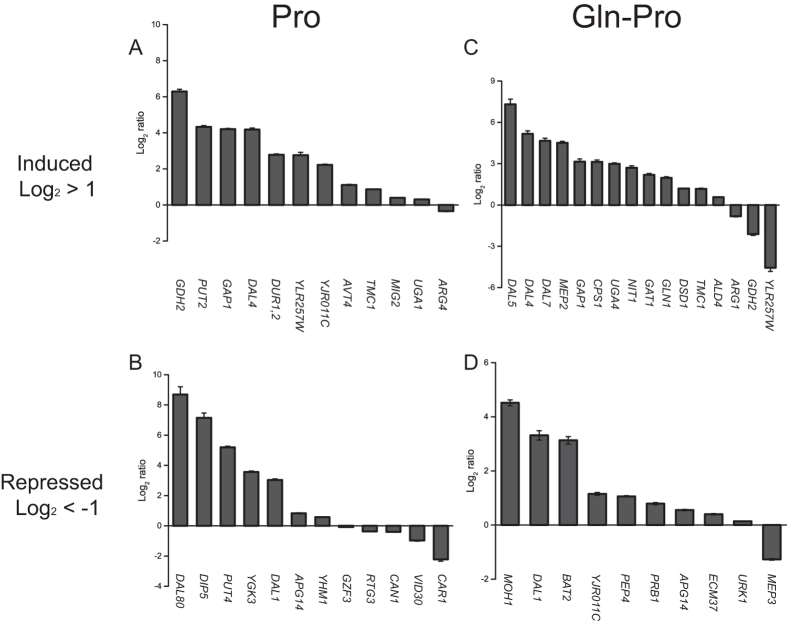
Figure 7. Comparison of nucleosome profile prediction and NCR-sensitive genes.
The dark grey column represents the strength of gene expression detected by qRT-PCR. Each gene was examined for three times. (A) The expression of nucleosome profiles activated genes in M.Pro medium; (B) The expression of nucleosome profiles repressed genes in M.Pro medium; (C) The expression of nucleosome profiles activated genes in M.Gln-Pro medium; (D) The expression of nucleosome profiles repressed genes in M.Gln-Pro medium.

