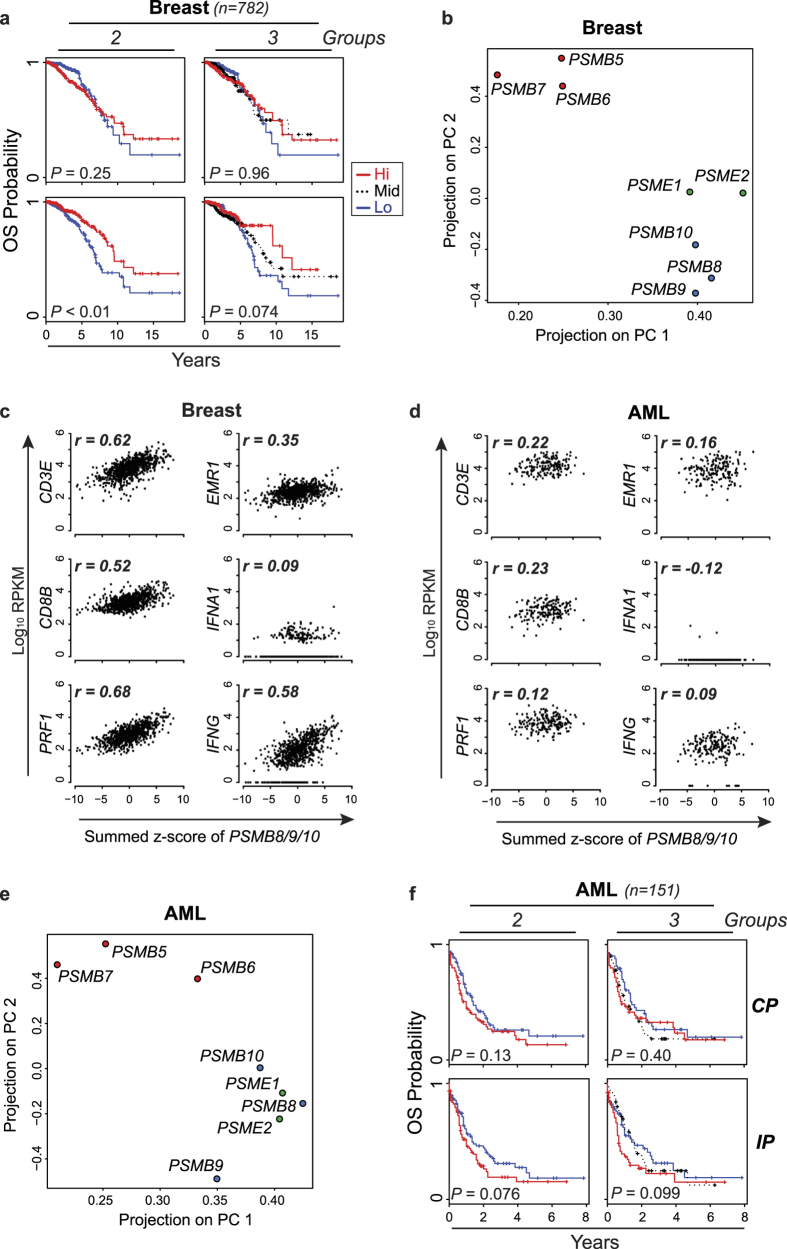
Figure 2. Expression of IP subunits is cell-autonomous in AML.
(a) Kaplan-Meier plots of overall survival (OS) for CPhigh vs. CPlow patients or IPhigh vs. IPlow patients with breast cancer. The log-rank test was used to calculate p-values. (b) Principal component analysis was performed on log10 RPKM values for genes encoding CP, IP and regulatory cap subunits (PSME1 and PSME2) in breast cancer. Plots represent the projections on the first and second principal components (PC). (c,d) For AML and breast cancer samples from TCGA, the summed z-scores of PSMB8/9/10 were plotted against log10 RPKM values of the indicated genes and Pearson’s correlation coefficient (r) was calculated. (e) Principal component analysis was performed for AML samples as described above. (f) Kaplan-Meier plots of overall survival (OS) for CPhigh vs. CPlow patients or IPhigh vs. IPlow patients in non-M3 AML samples. The log-rank test was used to calculate p-values.

