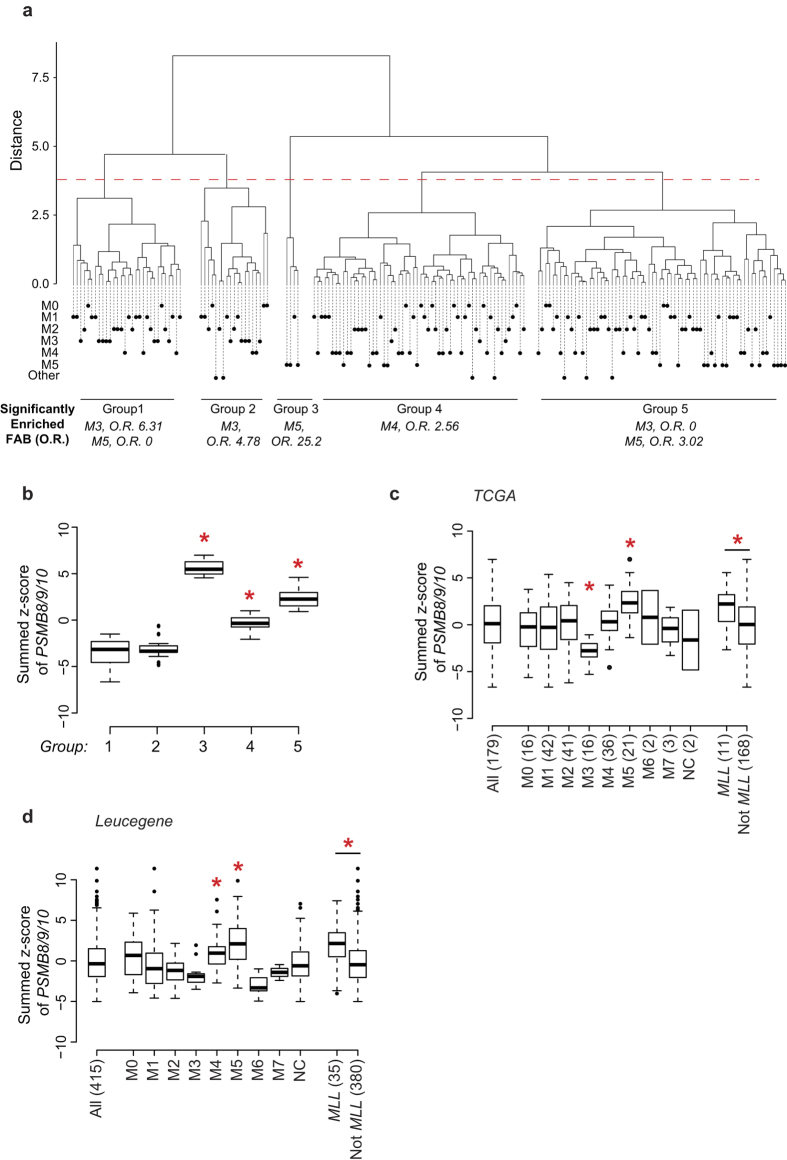
Figure 3. IP expression is upregulated in AML with an M5 phenotype or MLL rearrangements.
(a) AML samples from TCGA were subjected to hierarchical clustering based on the expression of IP-encoding genes and separated into 5 clusters. Leafs of the dendrogram are annotated with circles that represent individual samples and their FAB subgroup. Enrichment in specific FAB classes within groups was determined by Fisher’s exact test and overall enrichment (O.R.) is shown. (b) Summed z-score of PSMB8/9/10 in groups of patients separated by hierarchical clustering in (a). (c,d) Summed z-score of PSMB8/9/10 expression in primary AML samples from (c) TCGA or (d) Leucegene cohorts were analyzed according to FAB classification and presence of MLL rearrangement. Differences between means of FAB groups were determined by one-way analysis of variance (ANOVA) followed by Tukey’s post-hoc test, and difference between means as a function of MLL status was determined by Student’s t-test (*indicates p < 0.05). Numbers in parentheses indicate number of samples.

