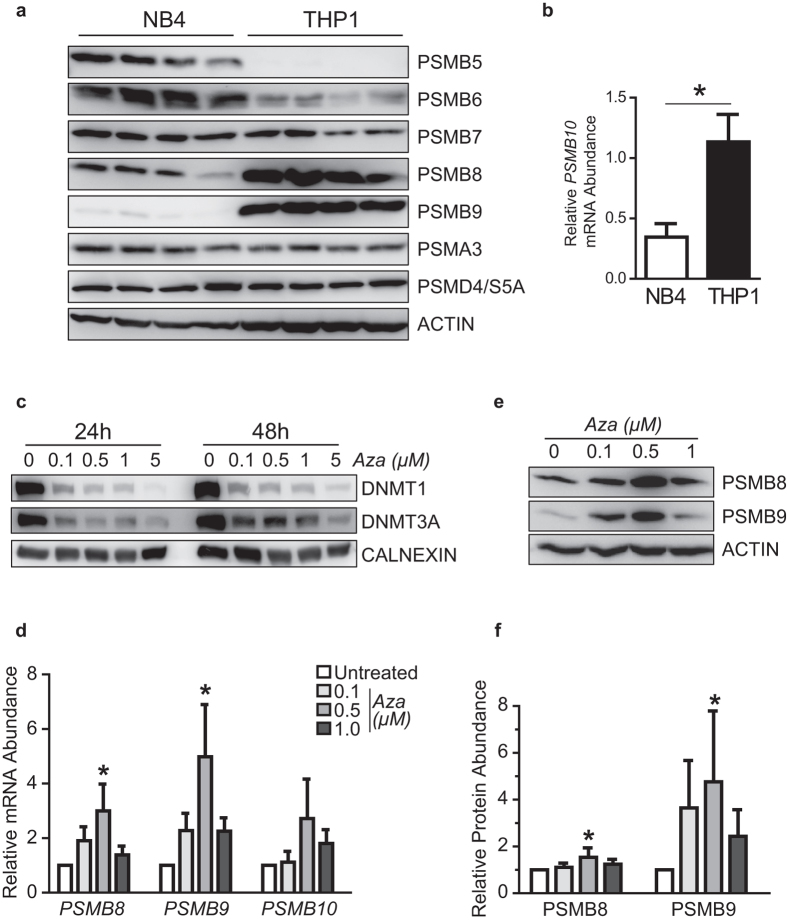
Figure 5. 5-azacytidine treatment increases levels of PSMB8 and PSMB9 in NB4 cells.
(a) Western blot analysis was performed to evaluate expression of proteasome subunits at the protein level in untreated THP1 and NB4 cells. β-actin serves as loading control. (b) Quantitative PCR analysis was performed on untreated THP1 and NB4 cells to determine total levels of PSMB10 transcripts and data were normalized according to expression of ACTB and TBP (mean ± SD of four independent experiments). (c–f) NB4 cells were treated with the indicated concentrations of 5-azacytidine for (c) 24, 48 or (e,f) 72 hours followed by western blot analysis, or (d) for 48 hours followed by quantitative PCR analysis (mean ± SD of three independent experiments). Data were normalized according to expression of ACTB and TBP for quantitative PCR and β-actin or Calnexin served as loading control for western blot. Blots are representative of three independent experiments and were quantified using ImageJ software. Differences in means between groups were determined by one-way analysis of variance (ANOVA) followed by Dunnett’s post-hoc test. (*Indicates p < 0.05). Aza: 5-azacytidine.

