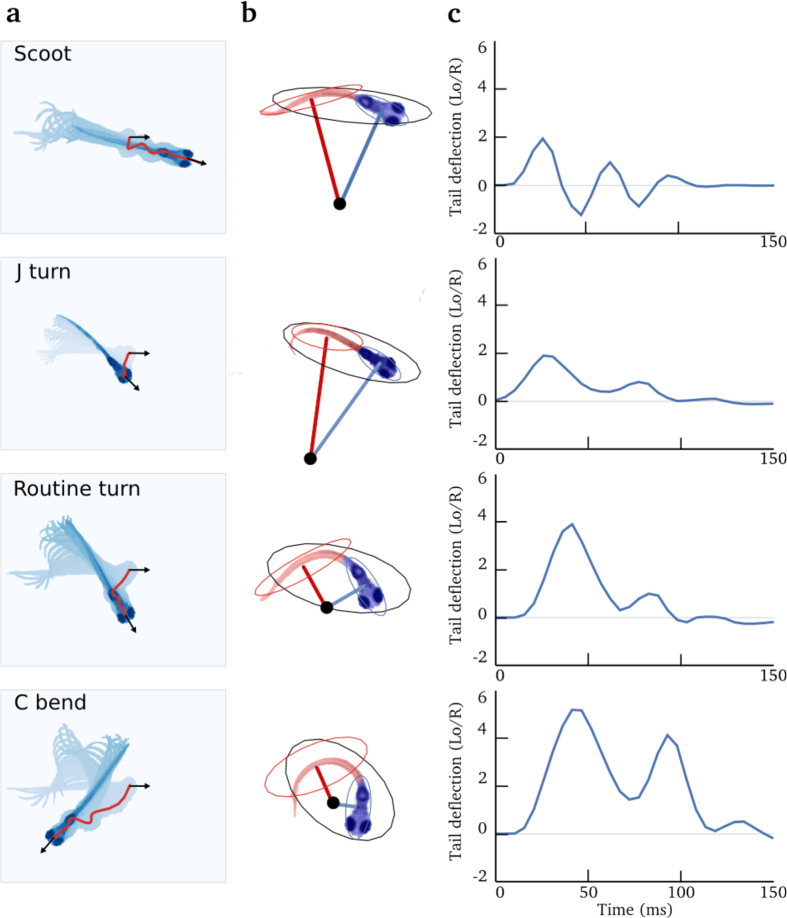
Figure 1. Quantification of tail movements in free-swimming conditions.
Row depict movements from different categories. (a) Superimposition of the image of a larva during a tail bout. The first image is in light blue and successive images are darker. The path followed by the head is shown by a red line, the black arrows represent the head orientation at the beginning and end of the bout. (b) Illustration of the image processing method to a characteristic snapshot of the movement in (a), an ellipse was fitted on the binarized image of the larva (in black). Pixels were split in two groups according to the major axis of the black ellipse: pixels shown in red or blue, superimposed on the larva. For each of these two groups of pixels, a second ellipse was fitted (red and blue ellipse) and the corresponding minor axes were drawn in red and blue. The center of curvature (black dot) was defined as the intersection between the two minor axes. The deflection was defined as the inverse of the average distance between all the pixels in the larva and the center of the curvature (1/R). To obtain a dimensionless value, the result was multiplied by the length of the larva at rest Lo. The sign of the deflection was computed as left = negative and right = positive. (c) The resulting deflection of the tail over time, for each of the different types of movements in (a).

