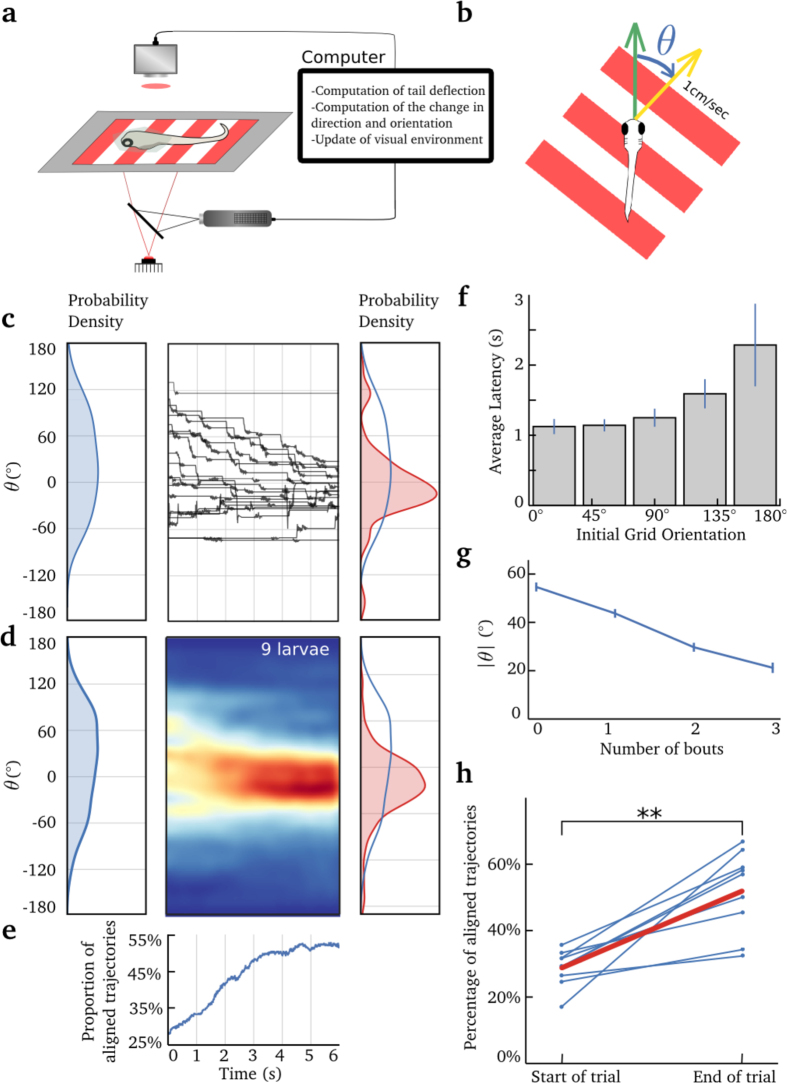
Figure 3. The optomotor response in virtual reality.
(a) A schematic of the experimental setup. The tail was imaged using a high-speed camera, an IR LED for illumination, and a high-pass filter to prevent the visual stimulus from reaching the camera. A projector was used to display the moving grating on a diffusive screen placed 0.5 cm below the larva. The larva was head-embedded in low-melting agarose at the bottom of a petri-dish. The tail was free to move. (b) The grating moved at 1 cm/s. θ represents the difference between the larva’s heading direction (green arrow) and the direction of the moving grating (yellow arrow). (c) Center panel: example of the changes in θ for one larva (20 trials). Left panel: Initial distribution of θ for the same larva. Right panel: Final orientation (θt=6s) distribution. The initial orientation distribution (θt=0) is superimposed in blue for comparison. (d) Left panel: Initial orientation distribution for all larvae and all trials for which at least one bout was generated. Center panel: color-coded density of trajectory as a function of time for the 6 s trials. Left panel: Initial distribution of θt=0 for all larvae. Right panel: Final orientation distribution (θt=6s) for all larvae. (e) Proportion of larvae aligned with the moving stimuli ( ) as a function of time during the trial. The time scale is common to (c), (d) and (e). (f) Histogram of latency as a function of the initial orientation of the grating, error bar indicates s.e.m. (g) Average of |θ|, for successive bouts, error bar indicates s.e.m. (h) Average percentage of trajectories aligned with the moving stimulus (
 ), at the beginning and at the end of the trials, for each larva. The average is shown in red.

