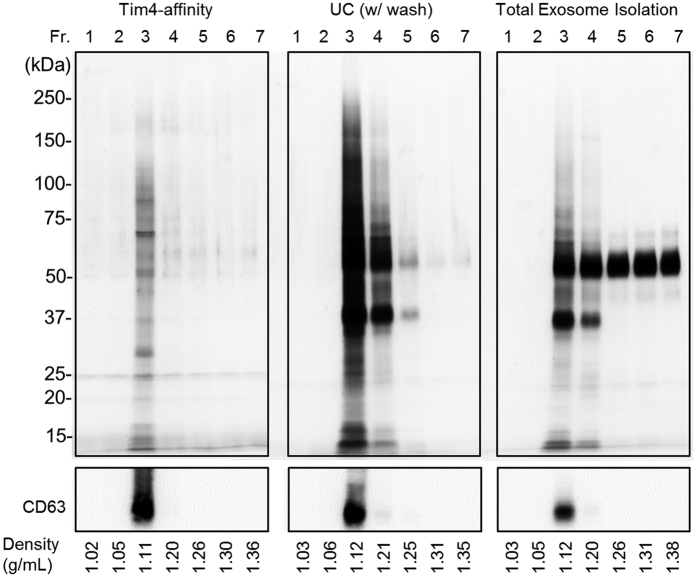
Figure 3. Density distribution of isolated sEVs.
sEVs isolated from 10K sup of K562 cells by each method were subjected to density gradient fractionation analysis by using OptiPrep. After centrifugation, series of fractions were collected and measured for density. The fractionated samples were concentrated, lysed with SDS sample buffer, and separated by SDS-PAGE. Proteins in each fraction were visualized by silver staining (for total proteins, upper panels) or western blotting with an exosomal marker (CD63) (lower panels).

