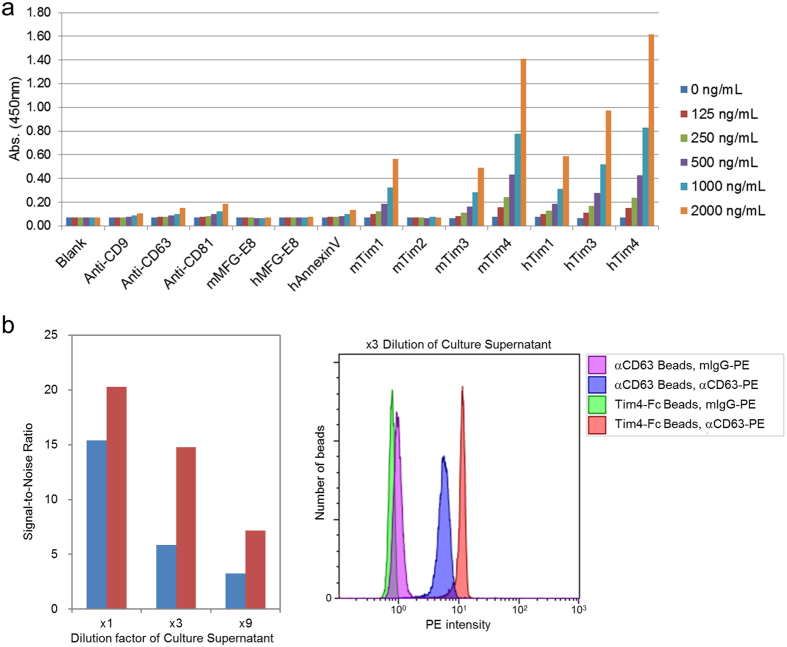
Figure 6. ELISA and FACS quantification of EVs.
(a) sEVs in 10K sup of K562 cells (serum free) were purified by ultracentrifugation and the concentration of total proteins was determined by BCA protein assay. The sEVs were serially diluted and then incubated in each well of a Nunc MaxiSorp 96 well plate that had been pre-coated with one of the following capture reagents: anti-CD9, anti-CD63, anti-CD81 antibody, mouse MFG-E8-His, human MFG-E8-His, human AnnexinV-His, mouse Tim1-Fc, Tim2-Fc, Tim3-Fc, Tim4-Fc, human Tim1-Fc, Tim3-Fc, or Tim4-Fc. Bound exosomes were detected with HRP-conjugated anti-CD63 monoclonal antibody, followed by a chemiluminescence reaction with TMB solution. The absorbance at 450 nm was measured with Ultra Evolution plate reader (Tecan). (b) sEVs in 10K sup of K562 cells (serum free) were serially diluted with RPMI1640 supplemented with 2 mM CaCl2 (×1, ×3, ×9), and then captured with beads conjugated either with anti-CD63 mouse monoclonal antibody (blue bars) or mouse Tim4-Fc (red bars). Bound exosomes were labeled using either PE-conjugated anti-CD63 mouse monoclonal antibody or PE-conjugated Mouse IgG1 κ Isotype Control, and analyzed using flow cytometry. Signal to Noise ratios (signal intensities of anti-CD63-PE divided by those of anti-mouse IgG1-PE) are shown in the left graph and the FACS profiles of samples diluted 1:3 are shown in the right panel.

