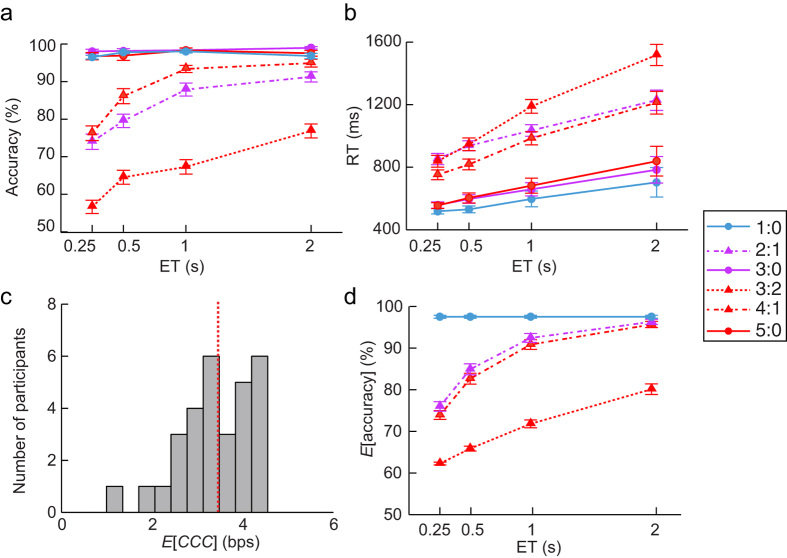
Figure 4. Empirical and predicted behavioral performance, and estimated capacity of cognitive control (E[CCC]).
Group-averaged accuracy (a) and reaction time (RT) (b) varied as a function of the ET and the entropy. (c) Histogram of the distribution of E[CCC] of the participants. The mean of the distribution is indicated by the intersection of the red dashed line with the x-axis. (d) Predicted accuracy (E[accuracy]) using the E[CCC], Entropy, and ET. The lines that represent the predicted accuracy in three congruent conditions (1:0, 3:0, and 5:0) overlapped because of the ceiling effects in these conditions. Error bars represent standard error.

