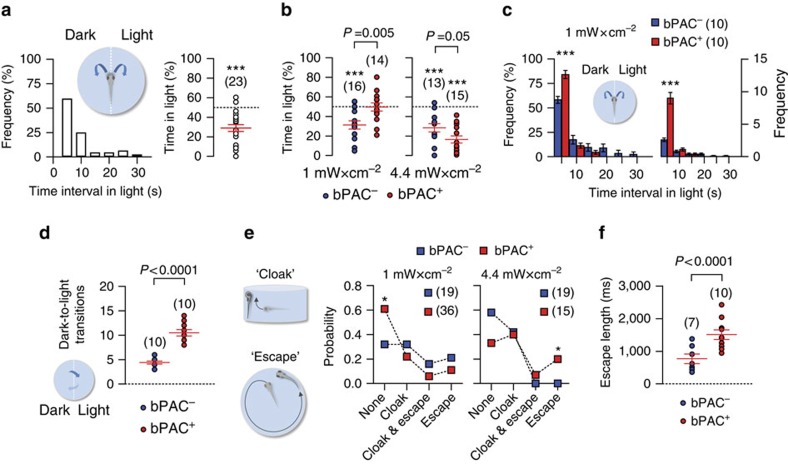
Figure 2. Enhanced pituitary corticotroph cell activity causes rapid adjustments of stressor avoidance.
(a) Inset, configuration for assessing light avoidance in freely swimming larvae. Left, distribution of time intervals under unfiltered light during a 120 s period of blue-light illumination. Right, cumulative time spent under blue light by individual wild-type larvae over a 120 s illumination period (in %) relative to a maximum of 120 s. (b) Cumulative time spent under blue light (as in a) by individual bPAC+ and bPAC− larvae for two different light powers; P values show results after two-tailed t-tests. (a,b) ***P<0.001 after one-sample t-tests against 50%. (c) Inset, configuration for assessing light avoidance in freely swimming larvae (as in a). Light power, 1 mW cm−2. Relative (in %) (left) and absolute (right) frequencies of time intervals under unfiltered light (mean±s.e.m.) by individual bPAC+ and bPAC− larvae during a 120 s period of blue-light illumination. ***P<0.001 after Two-tailed t-tests. (d), Total number of dark-to-light transitions by individual bPAC+ (red) and bPAC− (blue) larvae during the 120 s period of blue-light illumination (P value after a Two-tailed t-test). (e), Left, Scheme showing avoidance behaviours elicited by continuous light exposure: ‘cloak' (top), negative geotaxis combined with thigmotaxis and ‘escape' (bottom), a swimming burst. Right, probabilities of responses to blue light in bPAC+ and bPAC− larvae as a function of light power. *P<0.05 after G-tests. (f) Length of escape reactions by individual bPAC+ and bPAC− larvae during blue-light stimulation. Light power, 1 and 4.4 mW cm−2. P value after a two-tailed t-test. (a–f) Sample size in parentheses.

