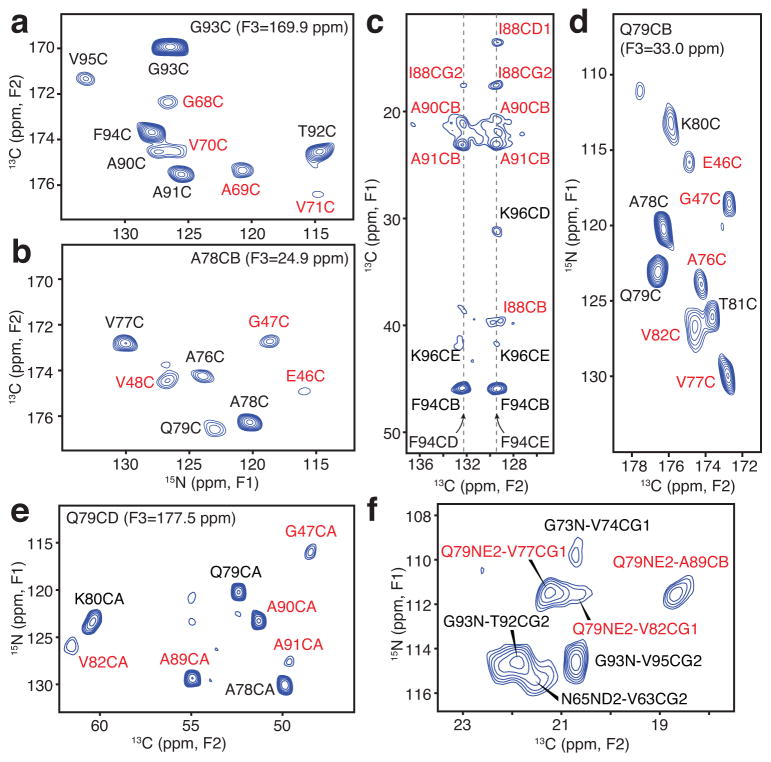
Figure 2. Long-range solid-state NMR structural restraints for an α-synuclein fibril.
(a–b) Two-dimensional (2D) 15N-13C planes from three-dimensional (3D) 15N-13CO-13CX spectrum with 500 ms dipolar-assisted rotational resonance (DARR) mixing22, collected with sample B (500 MHz 1H frequency, 11.111 kHz magic-angle spinning (MAS) rate, signal averaged 181.3 hours). (c) Aromatic-to-aliphatic region of 2D 13C-13C spectrum with 300 ms DARR mixing, collected with sample B (750 MHz 1H frequency, 12.5 kHz MAS rate, signal averaged 12.7 hours). (d) 2D plane from 15N-13CO-13CX spectrum with 500 ms DARR mixing collected with sample B (500 MHz 1H frequency, 11.111 kHz MAS rate, signal averaged 181.3 hours). (e) 2D plane from 15N-13CA-13CX spectrum with 500 ms DARR mixing collected with sample C (500 MHz 1H frequency, 11.111 kHz MAS rate, signal averaged 152.1 hours). (f) Region of 15N-13C spectrum for sample B with 6.4 ms transferred-echo double resonance (TEDOR) mixing24 (600 MHz 1H frequency, 10 kHz MAS rate, signal averaged 8.7 hours). Red labels indicate long-range correlations. distance restraints; black labels represent intraresidue and sequential correlations.

