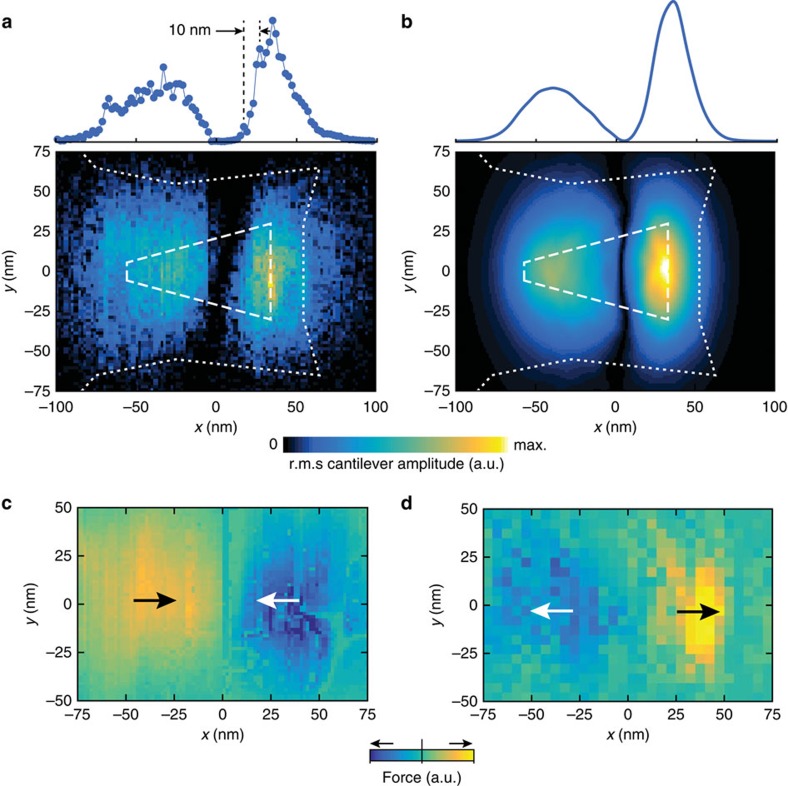
Figure 4. Two-dimensional imaging of pole field.
(a) Experimental force image recorded with tip A. Two lobes of increased signal are visible at the front and back ends of the pole where the gradient ∂x|B| is largest. The contours indicate the write pole (dashed) and shield (dotted). The traces above the image shows the signal intensity (r.m.s. squared cantilever oscillation) along the x direction. Point spacing is 2 nm with an integration time of 3 s per point. Drive current was 5 mA. (b) Independent finite element simulation based on the micrograph from Fig. 1d. (c,d) Phase-sensitive force images recorded by a paramagnetic Pt-coated tip A (c) and by the diamagnetic bare diamond tip B (d), demonstrating that the sign of χ can be detected. Arrows point in the direction of the force. Colour bar scale is linear. Scan height was 15 nm for tip A and 30 nm for tip B, and drive was 5 mA.

