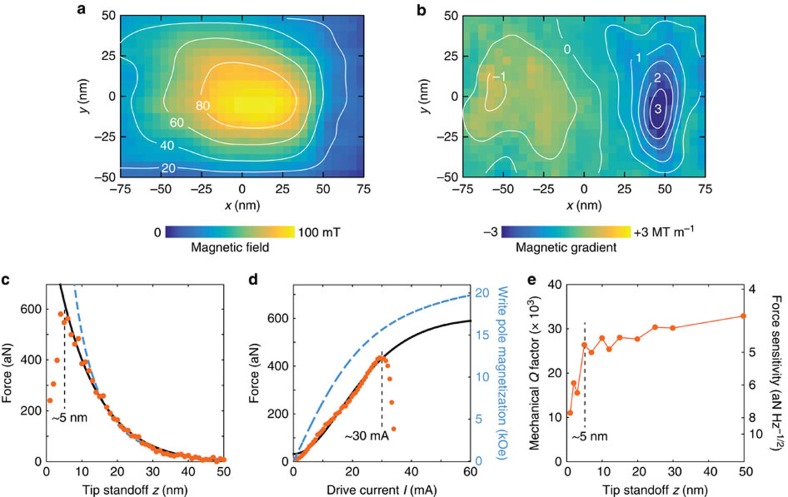
Figure 5. Quantitative field maps and estimated limits.
(a,b) Two-dimensional images of the magnetic field (a) and field gradient (b) for 5 mA drive and 30 nm standoff. Contour labels are mT and MT m−1, respectively. (c) Force signal as a function of tip standoff z, measured at the xy location with the highest signal. The solid line is an exponential fit with decay length δ=11.3±0.6 nm. The dashed line is the prediction by the finite element model that was vertically scaled to fit the data. Drive was 12 mA. (d) Cantilever signal as the drive was increased beyond the breakdown current of ∼30 mA. The solid line is a fit based on the magnetization curve of FeCo (Supplementary Information). The dashed line (right scale) is the associated pole magnetization. Tip standoff was 20 nm. All data are from tip B. (e) Mechanical quality factor Q and force sensitivity Fmin of the transducer as a function of tip standoff z. A force sensitivity of ∼5 aN Hz−1/2 is maintained down to z=5 nm.

