
Figure 4. Transcranial FUS targeted to the V1 elicits the EEG evoked potentials.
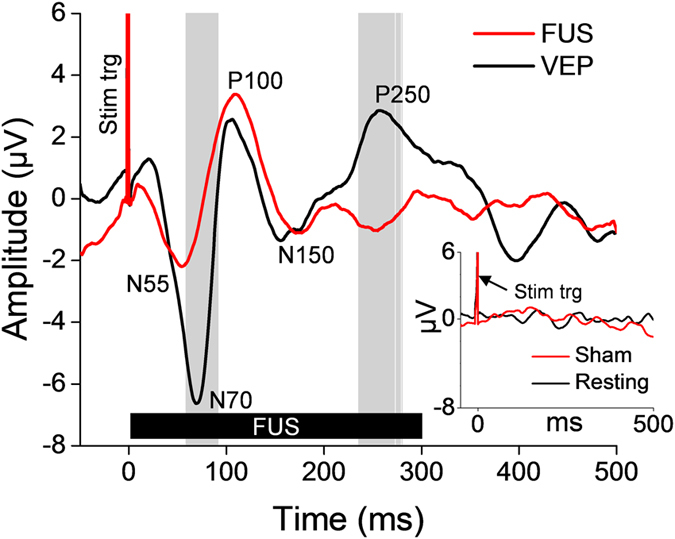
The grand average (N = 10; 50 trials per stimulation condition) EEG evoked potentials elicited by transcranial FUS to the primary visual cortex (red line) and VEP separately elicited by photic stimulation (black line). The FUS was given for a period of 300 ms (thick solid black bar labeled as ‘FUS’) while the 50 ms-long photic stimulation was given (not shown on the plot). Positive (noted with prefix P) and negative (noted with prefix N) peaks of the evoked potentials are annotated. Gray vertical bars indicate the time-segments that showed significant differences in amplitudes between the VEP and the FUS-mediated evoked potentials (P < 10−3). A spike of stimulation triggering signal is labeled as ‘Stim trig.’ The inset shows the EEG signals measured at the same electrode site from the resting-state (i.e., no stimulation, black line) and the sham FUS conditions (red line).