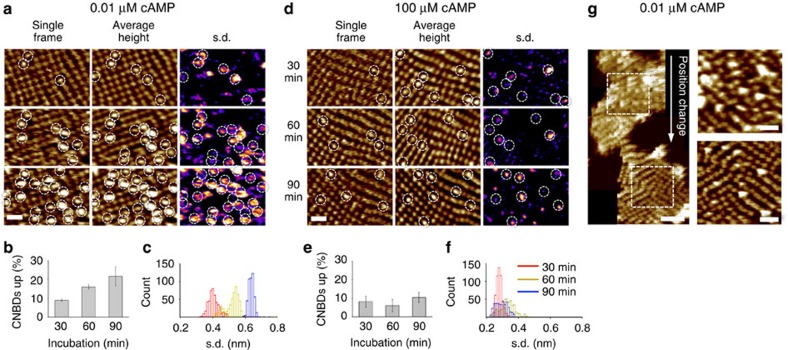
Figure 3. The number of blinking MloK1 channels increases over time at low ligand concentration.
(a) Representative membrane imaged after 30 (upper), 60 (centre) and 90 (lower) minutes in 10 nM cAMP. For each condition, a single HS-AFM frame (left), the average height (middle) and the s.d. map (right) of the complete movie are shown. Blinking channels are highlighted by circles. While the single frame only shows MloK1s with elevated CNBDs at a given time, the average height-map displays all molecules with elevated heights throughout the movie, and the s.d.-map highlights the pixels changing over time, a hallmark of blinking. (b) The percentage of blinking channels in 10 nM cAMP plotted as a function of incubation time (mean±s.d.). (c) Histograms of the s.d. of all pixel values in each movie frame from a membrane area of 12,750 nm2 (15,000 pixels) and ∼500 frames at 10 nM cAMP after 30 (red), 60 (yellow) and 90 (blue) minutes. An increase in the s.d. reflects increased blinking. (d–f) as described in a–c, but in the presence of 100 μM cAMP. In contrast to the low-cAMP condition, the number and intensity of blinking molecules stays virtually identical over time. (g) The height increase of the CNBD in low cAMP requires an input of energy provided by the AFM tip. The imaged membrane area shows an increasing number of blinking molecules (upper), while most MloK channels are in cAMP-bound conformation in the untouched membrane area (lower). The full colour scales and scale bars are identical for all AFM images and correspond to 3 nm (z) and 30 nm (x/y).

