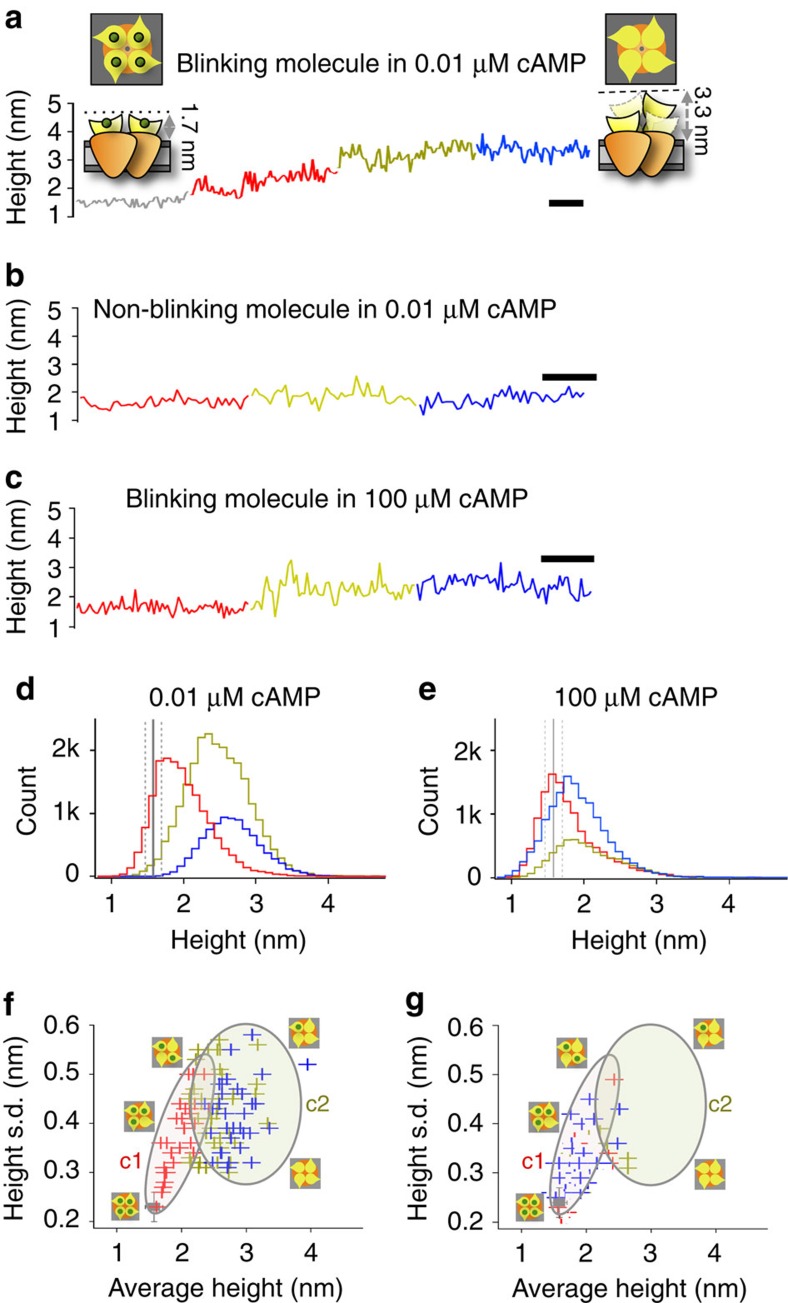
Figure 5. MloK1 blinking heights increase over time in low cAMP.
(a) Height versus time representative trace of an individual channel after incubation for 30 (red), 60 (yellow) and 90 (blue) minutes in 10 nM cAMP. A non-blinking channel from the same patch is shown in grey. Over time the molecule traverses several height levels. Cartoons representing liganded and unliganded MloK1 are shown. (b) Height versus time representative trace of a non-blinking channel after 30, 60 and 90 min in 10 nM cAMP (same colour scheme as in a). In contrast to the blinking molecule, no progressive height increase could be detected. (c) Height versus time representative trace of a blinking channel at 100 μM cAMP after 30, 60 and 90 min (same colour scheme as in a). The molecule starts blinking at the second scanning round (60 min) and keeps blinking at the same height level throughout the entire experiment. Scale bar: 10 s (a–c). (d,e) Histograms of MloK1 heights after 30, 60 and 90 min incubation in 10 nM cAMP (d) or100μM cAMP (e), respectively. Colour code is as in a. As a reference, the average height (solid line) and s.d. (dashed line) of non-blinking down-state molecules (grey, n=18 (10 nM cAMP) and n=15 (100 μM cAMP) molecules) are shown. (f) Correlation between average height and height s.d. for each molecule at 10 nM cAMP. Colour code as above. Each cross in the distribution is the average height of a single molecule plotted against the s.d. from all 500 frames. Mean±s.d. of non-blinking molecules (n=18) are shown as a grey square. Blinking molecules pass through different height regimes (clusters c1 and c2, outlined by large circles). (g) correlation between average height and height s.d., at 100 μM cAMP. Mean±s.d. of non-blinking molecules (n=15) is shown as a grey square.

