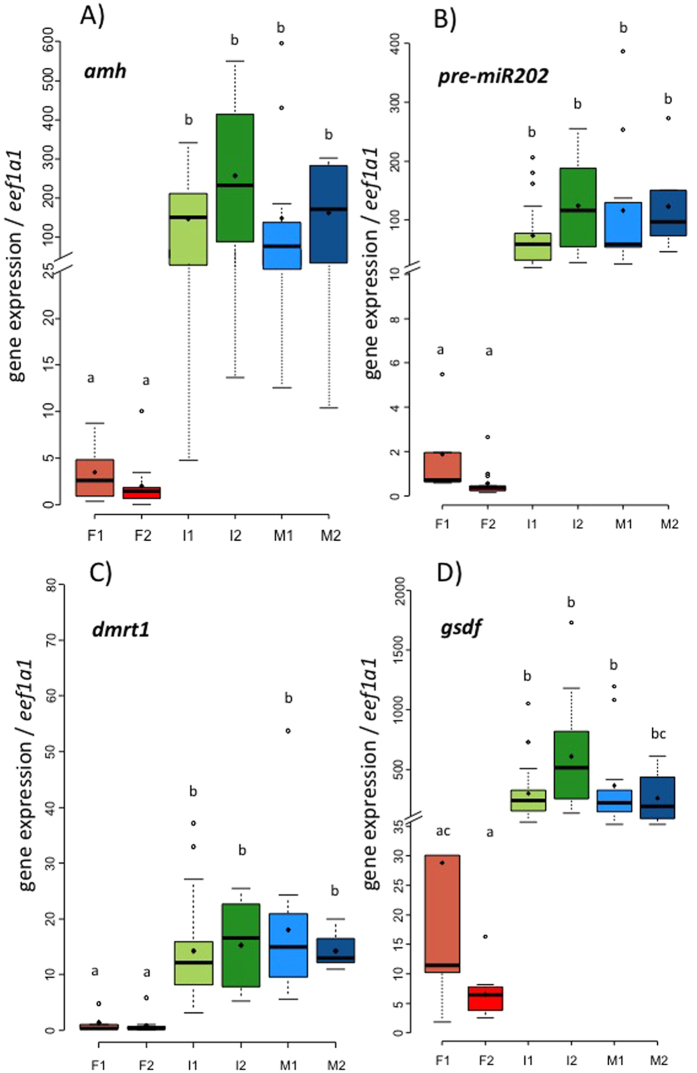
Figure 2.
Boxplots showing the expression patterns of (A) amh, (B) pre-miR202, (C) dmrt1 and (D) gsdf relative to the expression of eef1a1 in gonads of males, females and intersexual eels at different gonadal stages. Different lowercase letters indicate significant difference (threshold p-value = 0.05) between groups. Number of samples per group: F1 = 5, F2 = 14, I1 = 19, I2 = 12, M1 = 10, M2 = 7.

