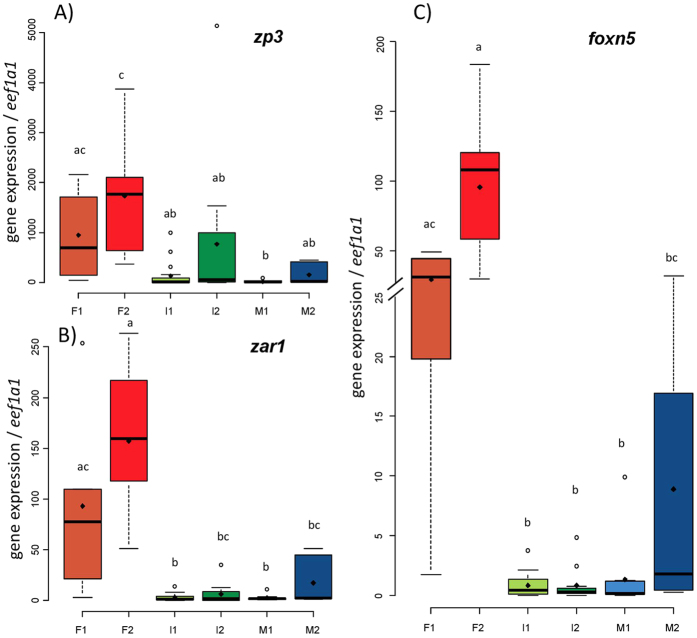
Figure 3.
Boxplots showing the expression patterns of (A) zp3, (B) zar1 and (C) foxn5 relative to eef1a1 in gonads of males, females and intersexual eels at different gonadal stages. Different lowercase letters indicate significant difference (threshold p-value = 0.05) between groups. Number of samples per group: F1 = 5, F2 = 14, I1 = 19, I2 = 12, M1 = 10, M2 = 7.

