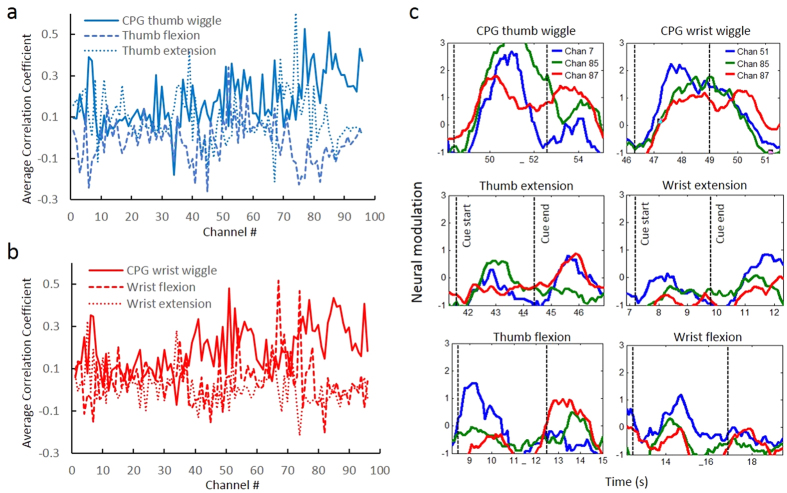
Figure 4. Correlation between neural activity and cue.
(a,b) Correlation coefficient between neural activity and cue vector was calculated for each motion for each array channel and shows the change in modulation levels on certain channels when imagining wiggle compared to flexion and extension. (c) Modulation in neural activity on a few representative channels clearly shows distinct neural modulation on these channels when imagining rhythmic wiggle compared to discrete flexion and extension of the thumb and wrist. Data shown ranges from 0.3 seconds before the cue to 2.5 s after the cue ended.

