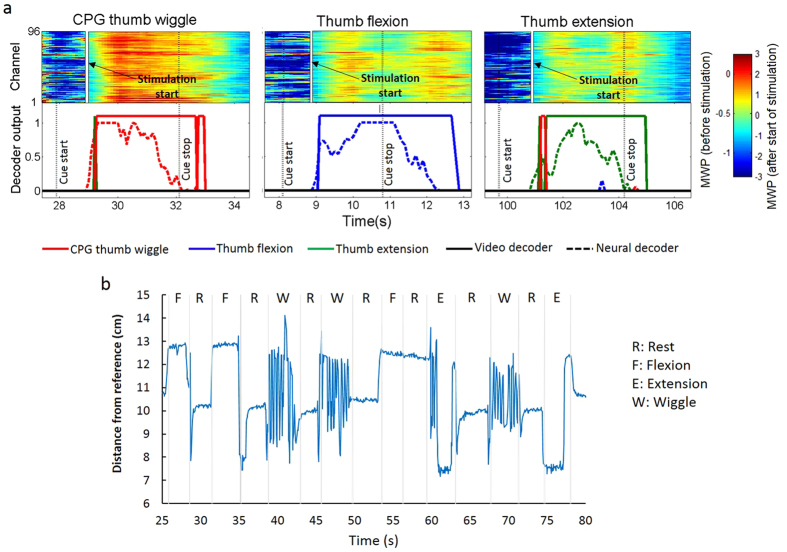
Figure 5. CPG task performance.
(a) Subfigures show heat maps of MWP representing processed signals from the microelectrode array, neural decoder output scores (dashed line), and physical thumb movements (solid line), as detected by a computer-based video classification algorithm. Of the three simultaneously running decoders, the output score from the one with the highest amplitude greater than zero was used to turn on/off the stimulation. The vertical white line marks when the decoder crosses zero and the stimulation is turned on. MWP increases during stimulation due to residual stimulation artifact (see Methods). The MWP plot is therefore split into two areas with two different color scales (one each for pre- and post-stimulation patterns) to facilitate better visualization of these patterns. The neural decoders are robust to any stimulation induced effects as they not only recognize the correct imagined movement to initiate stimulation but also continue to recognize the participant’s desire to sustain and subsequently terminate the stimulation-induced movement. Trial data shown ranges from 0.3 s before the cue to 2.5 s after the cue ended. A 1 s boxcar filter is applied to the MWP data causing a delay of ~0.5 s. The MWP is in units of standard deviations away from a baseline non-movement period. Only decoder outputs greater than zero are shown for visual clarity; (b) shows the results from finger motion tracking for each motion: thumb flexion (F), thumb extension (E), thumb wiggle (W) and a rest (R) in between each motion obtained from the 3D stereo camera mounted overhead. The output is measured as the distance of the finger from a reference point (“sixth finger”, see Methods).

