Figure 1.
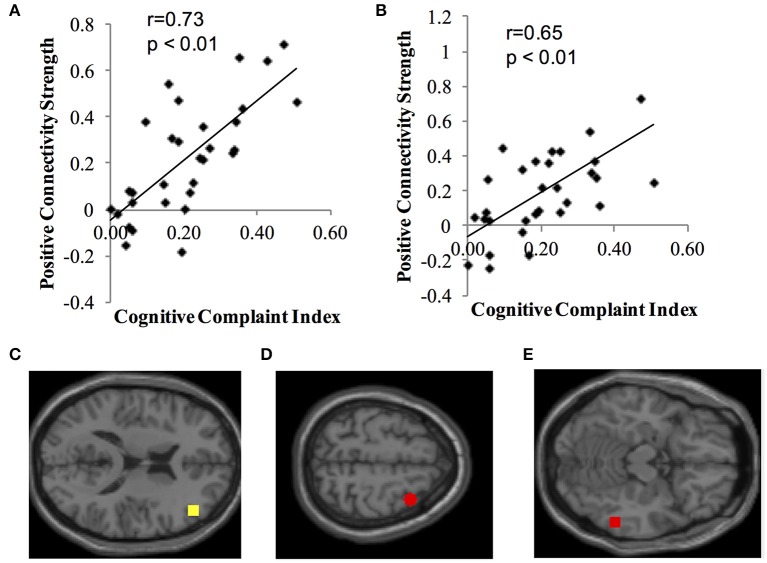
Positive correlation between functional connectivity of the ECN and CCI. Data show positive connectivity. (A) Y-axis depicts functional connectivity between the right seed region for the ECN (dorsolateral frontal cortex) and MNI 36, 10, 60 (right middle frontal gyrus). (B) Y-axis depicts functional connectivity between the right dorsolateral frontal cortex and MNI 58, −46, −14 (right temporal lobe, fusiform gyrus). (C) Yellow dot indicates the location of the seed region for the ECN, right dorsolateral prefrontal cortex. (D) Red dot indicates the location of the target region expressing functional connectivity with the dorsolateral prefrontal cortex in (A) (MNI 36, 10, 60; right middle frontal gyrus). (E) Red dot indicates the location of the target region expressing functional connectivity with the dorsolateral prefrontal cortex in (B) (MNI 58, −46, −14; right temporal lobe, fusiform gyrus).

