
Fig. 4.
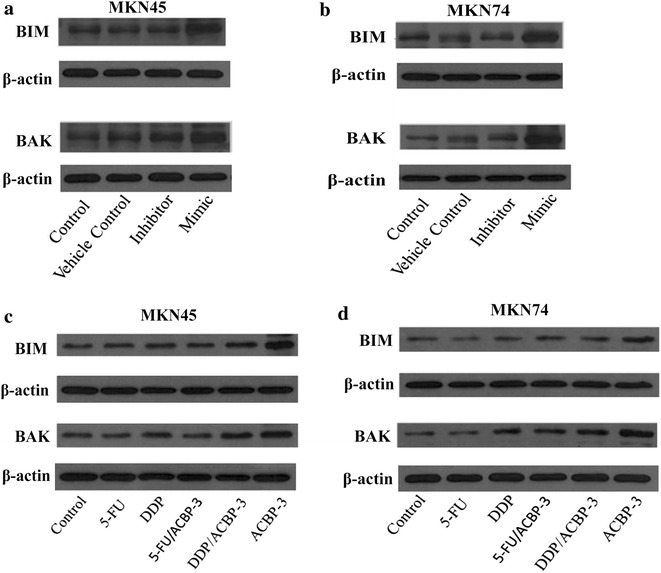
Correlation between miR-338-5p expression and the relative level of BIM and BAK. BIM and BAK expression was analyzed by western blotting in GCSCs transfected with miR-338-5p mimic and inhibitor. Representative blots are shown for miR-338-5p overexpression experiments in transfected MKN45 (a) and MKN74 GCSCs (b). β-actin was used as a reference. The protein expression of BIM and BAK is shown for GCSCs treated with 5-FU, DDP groups, 5-Fu/ACBP-3, DDP/ACBP-3, ACBP-3 or a control for 48 h. Transfected MKN45 cells (c) and MKN74 cells (d) are shown, and β-actin was used as a reference