Figure 6.

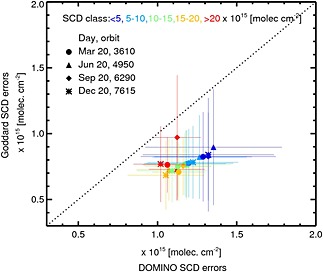
SCD(NO2) errors for different SCDs (color coded: see the figure legend) and different months, with ±σ bars, to show the spread of the values.

SCD(NO2) errors for different SCDs (color coded: see the figure legend) and different months, with ±σ bars, to show the spread of the values.