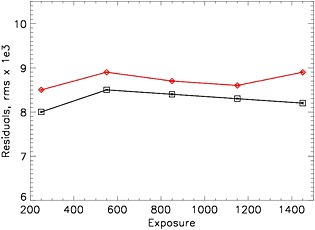
Figure A5.

The average RMS (blocks of 100 orbital exposures, all FOVs (rows) included) of the fitting residuals for the single‐window approach are shown as red diamonds. Black line follows the multiwindow results (squares) for the test orbit #03610. The corresponding ±1σ errors of the mean values are smaller than the symbol sizes.
