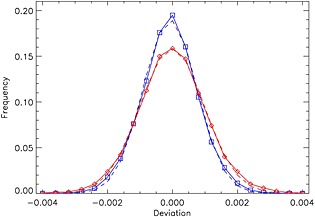
Figure A14.

Histograms of the fitting residuals for the orbital exposure #1131, orbit #03610. Full lines (red for Bremen and blue for Goddard) show the fitting residual distributions, while the dashed lines show the corresponding Gaussian function fits.
