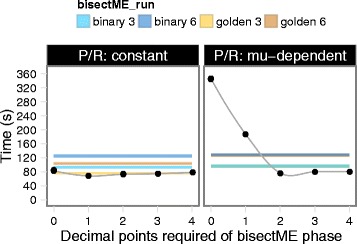
Fig. 2.

Performance of the combined solveME procedure. Colored bands represent the range of solution times (3 replicate runs) for the binary or golden section search methods with growth rate convergence to 3 or 6 decimal points. Points show solution time for the combined solveME procedure (3 replicate runs each) for varying decimal points required at the bisectME phase. The protein-per-RNA ratio (P/R) in the ME model was either constant (left) or growth-rate dependent as in [5] (right). Uptake rates were free in both cases, such that proteome limitation eventually constrained uptake rates
