Fig. 3.

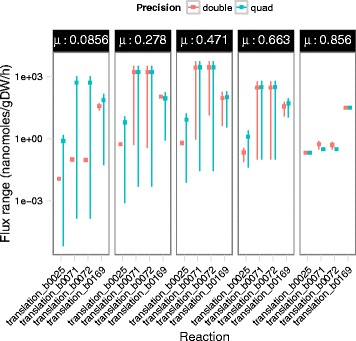
Comparison of FVA in quad- and double-precision. Growth rates were varied from 10 to 100 % of the maximum). Lines span the minimum and maximum fluxes, while points show the mid-point between these ranges. The y-axis is in log-scale

Comparison of FVA in quad- and double-precision. Growth rates were varied from 10 to 100 % of the maximum). Lines span the minimum and maximum fluxes, while points show the mid-point between these ranges. The y-axis is in log-scale