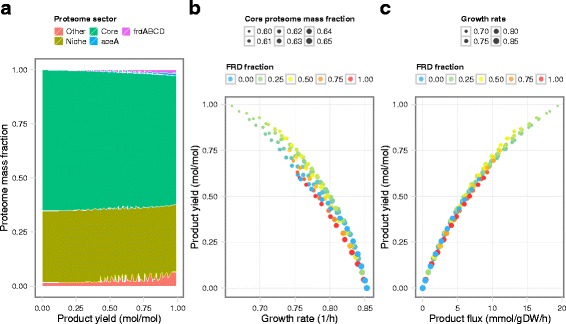
Fig. 4.

Growth-coupled succinate production performance predicted by solveME. a Mass fraction of proteome sectors as a function of product yield. b Product yield vs. maximum growth rate. c Product yield vs. product flux. Colors in (b) and (c) are proportional to the FRD fraction, which is the mole fraction of translation flux to FRD vs. total flux to succinate production pathways (FRD and AceA)
