
Fig. 5.
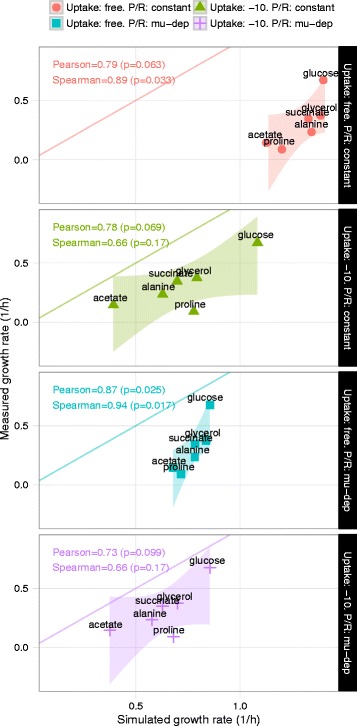
Accuracy of quantitative growth rate predictions. Each panel corresponds to whether a constant or growth rate-dependent P/R ratio was used, and whether uptake rates were left unconstrained (proteome-limited growth) or constrained to −10 mmol/gDW/h. The lines correspond to perfect agreement between measured and simulated growth rates. Colored shadings represent 95 % confidence intervals for a linear model fit of the data points computed using ggplot2 in R