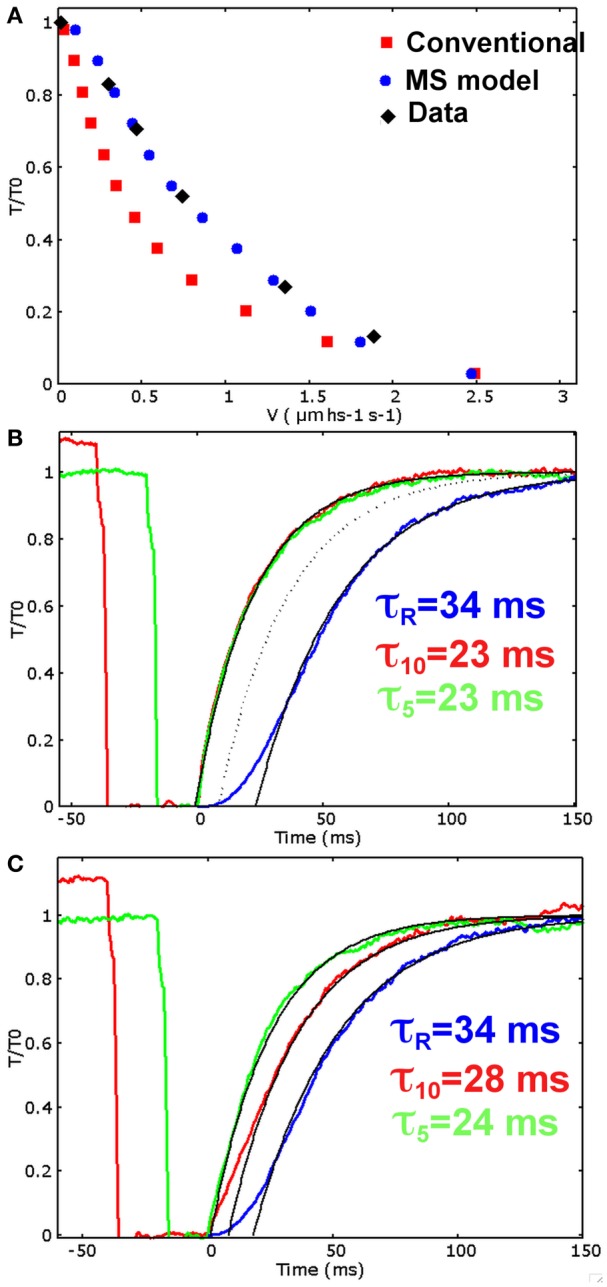
Figure 3.

Simulations for the two models. (A) Simulated and experimental data for the tension-velocity curves. Experimental data: filled diamond (from Piazzesi et al., 2007), conventional model: red squares, MS model: blue dots. (B) Conventional model. Simulated rise in tension after initial activation (blue), and tension recovery after 40 (red) and 20 (green) milliseconds at zero tension shortening phase, corresponding to 10% and 5% of muscle length shortening respectively. The rise in tension after activation is comparable with the experimental data, as well as the recovery after 20 ms at zero tension, but the recovery rate does not depend on the duration of the zero tension period. (C) MS model. Simulated rise in tension after initial activation (blue), and tension recovery after 40 (red) and 20 (green) milliseconds at unloaded shortening. The single exponential fitting with the experimentally observed time scales well match the simulated tensions (τR = 34 ms for the rise after activation, τ10 = 28 ms after 10% of muscle length shortening, and τ5 = 24 ms after 5% of muscle length shortening). Also the time delay are quite similar to the experimental data (Linari et al., 2015) (18, 8, and 1 ms for the activation, 40 and 20 ms protocols respectively. Experimental data are 21, 2, and 0 ms).
