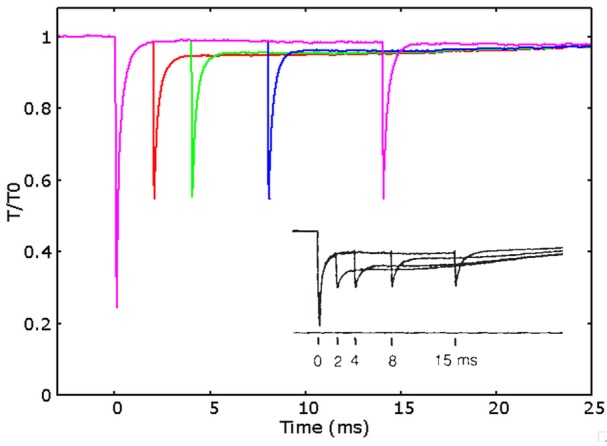
Figure 5.

Fast recovery of the power stroke. Simulated relative tension vs. time after a conditioning length step of 5 nm and a test step of 2 nm applied after 2 ms (red), 4 ms (green), 8 ms (blue), and 14 ms (pink) after the conditioning step. The tension recovered after the test step increases with the time delayed after the conditioning step, semi-quantitatively fitting the experimental data (shown in the figure, adapted by permission from Macmillan Publishers Ltd: Nature Lombardi et al., 1992, copyright 1992).
