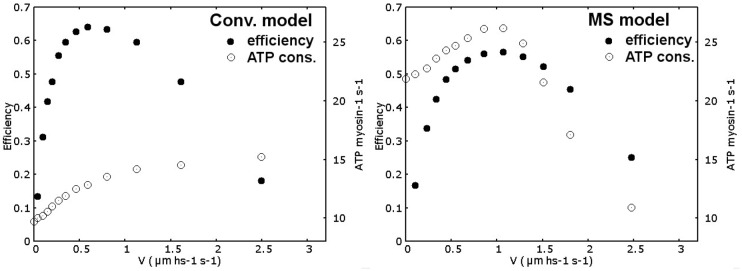
Figure 6.
Efficiency and ATP consumption. Efficiency (filled dots) at different shortening velocities simulated by the conventional model (left panel) and MS model (right panel) is computed as work done (force times displacement) divided by ATP consumed (85 pNnm per ATP) in a given amount of time. ATP consumption per myosin per second (empty dots) is also reported for both models. While in the conventional model it is monotonically increasing, MS model predicts a maximum in energy consumption at intermediate velocities.

