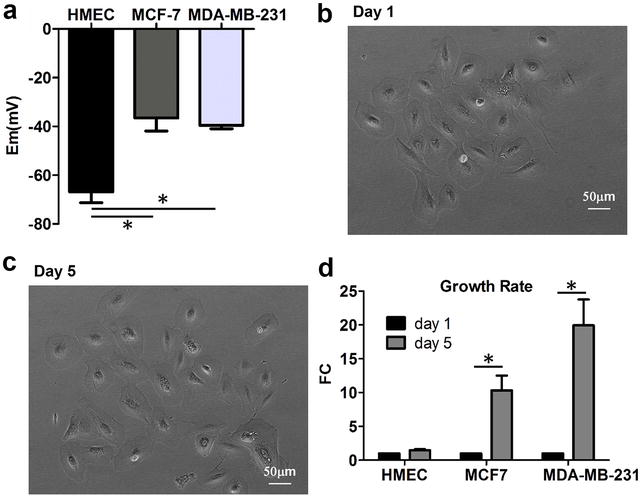
Fig. 1.

Bioelectricity and cell growth. a Resting membrane potential (Em) in HMEC, MCF7, and MDA-MB-231, n = 10 for each group. b HMEC at day 1. c HMEC at day 5. d Cell growth at day 5 compared to day 1 (normalized) for HMEC, MCF7, and MDA-MB-231. n = 4 for each group. FC fold change. Asterisk indicates statistical significance
